
Figure 5. Proteome of persisters has enhanced catabolism and activation of stress response.
-
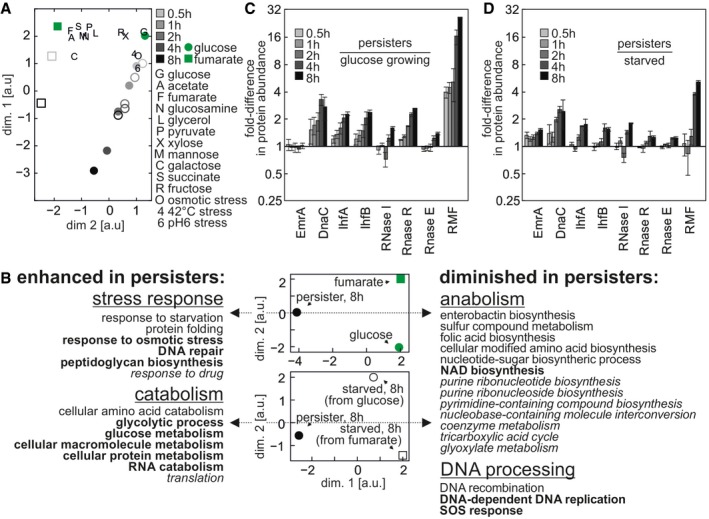
AProjection of E. coli proteomes in various growth and stress conditions (Schmidt et al, 2016) on the PCA space created by proteomes generated in this study.
-
BPCA of proteomes of persister, fumarate‐growing, and glucose‐growing cells (upper panel); PCA of proteomes of persister cells and starved cells growing on glucose or fumarate before starvation (lower panel), markers as in (A). GOterms shared between the two analyses (i.e. persisters versus growing cells and persisters versus starved cells) are indicated in bold. GOterms specific to persisters versus starved cells analysis are indicated in italics. For a ranked list of assigned GOterms, see Appendix Table S3. See also Appendix Fig S2 showing expression levels of proteins involved in Escherichia coli central metabolic pathways.
-
C, DTime profiles of abundance of selected proteins that are significantly correlated with the persister phenotype in both PCA (i.e. proteins for which the correlation coefficient had P < 0.1). Abundance relative to cells growing on glucose (C) or relative to starved cells (D). Error bars indicate one standard deviation reflecting variation between technical replicates.
Source data are available online for this figure.