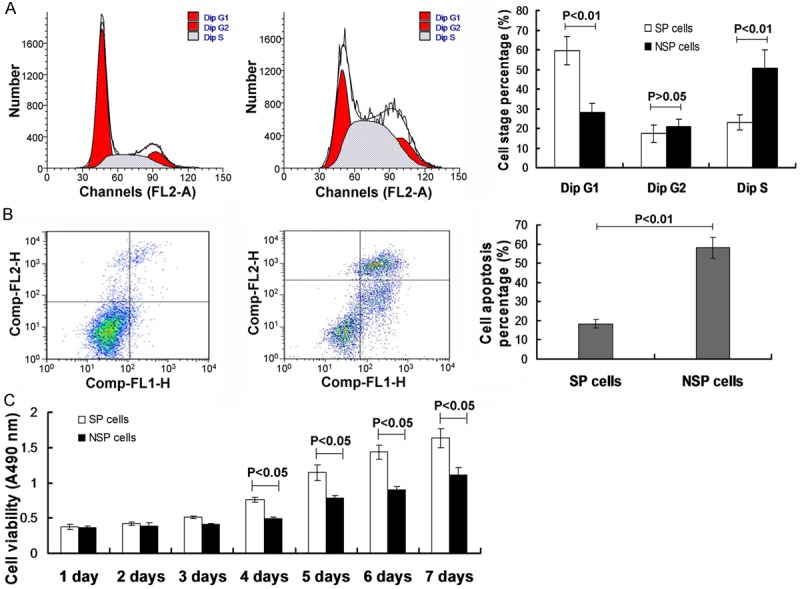
Figure 2.

Observation for the cell cycle stage, cell apoptosis and cell proliferative ability. (A) Cell cycle stage investigation via flow cytometry assay, and statisitical analysis. (B) Cell apoptosis analysis by using the flow cytometry assay and the statistical analysis. (C) Cell proliferation analysis by using the MTT assay. P<0.05, *P<0.01 represent the cell cycel stage (A), cell apoptosis percentage (B) and cell proliferative viability (C) in SP cells compared to the NSP cells.
