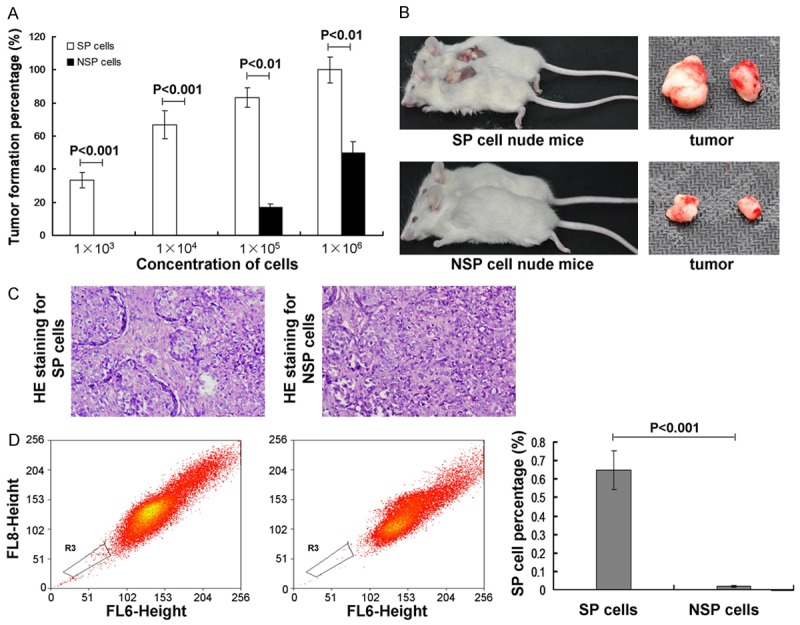
Figure 5.

Observation for the tumor formation by using tumorigenicity assay. A. Transplantation tumor formation at different concentrations of cells at the 8 weeks in both SP cells and NSP cells. B. The SP cell or NSP cells nude mice and the transplantation tumors. C. HE stianing for the histo-morphology for SP or NSP originated tumor tissues. D. SP cell percentage in the transplanted tumors. P<0.01 represents the tumor formation percentage in SP cell nude mice compared to NSP cell nude mice. P<0.001 represents the SP cell percentage in SP cell nude mice compared to NSP cell nude mice.
