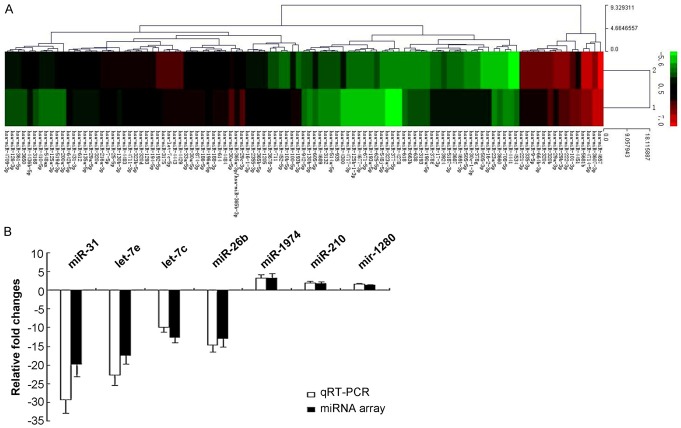
Figure 6.
miRNA expression evaluated by using micro-array and RT-PCR methods. A. Heat map of altered miRNA expression. A heat map was generated using the expression raios of 107 miRNAs that differed significantly in SP compared to NSP cells, according to significance analysis of micro-array. Red indicates high relative expression, and green indicates low relative expression. “1” represents the SP cells, “2” represents the NSP cells. B. Validation of micro-array data using real-time RT-PCR.

