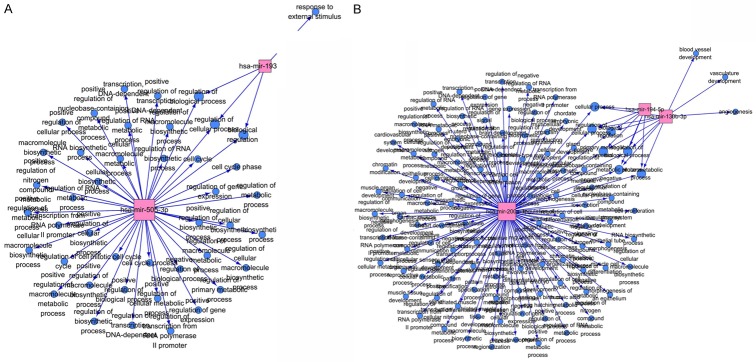
Figure 8.
GO network for the miRNAs. A. GO network for the hsa-miR-193b-3p and hsa-miR-505-3p. B. GO network for the hsa-miR-200a-3p, hsa-miR-194-5p and hsa-miR-130b-3p. The red and quadrate note represents the miRNAs. The blue-black circle note represents the function terms. The node size reflects it’s correlation with the Edges.

