Figure 1.

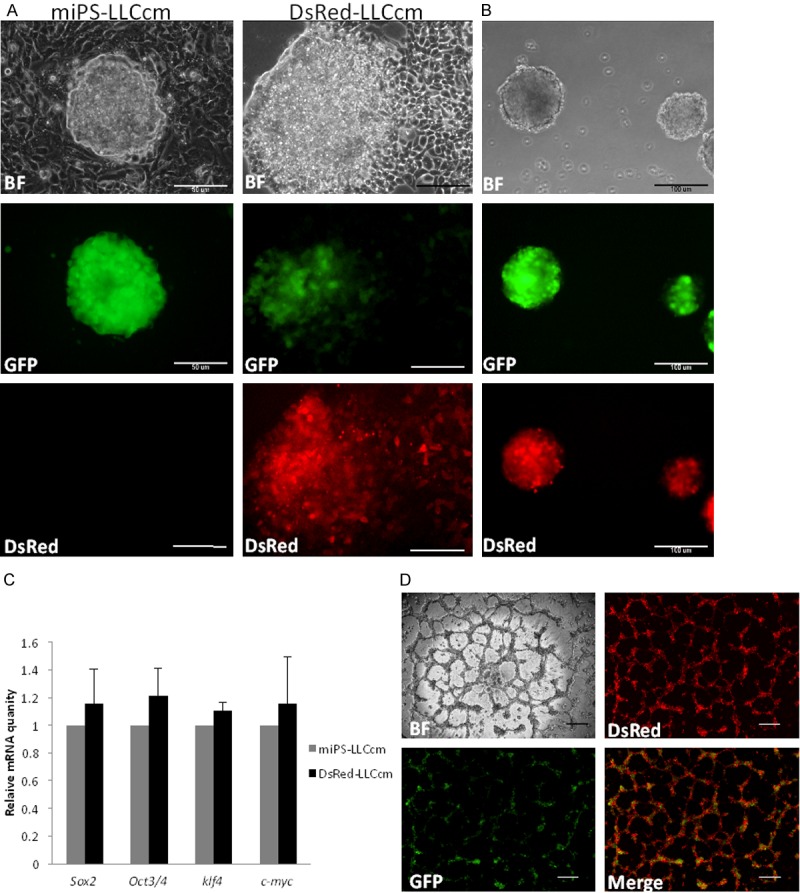
Establishment of Ds-Red expressing miPS-LLCcm, DsRed-LLCcm. A: Morphology of miPS-LLCcm and DsRed-LLCcm cells. Under the control of EF1 promoter, DsRed was expressed constitutively. Scale bar: 50 µm. B: Sphere formation of DsRed-LLCcm cells, all the spheres are GFP+ and DsRed+. Scale bar: 100 µm. C: Expression levels of Sox2, Oct3/4, Klf4, and C-myc in DsRed-LLCcm cells were analyzed by RT-qPCR. Equivalent expressions of those genes in comparison to miPS-LLCcm were confirmed (Sox2 p=0.71; Oct3/4 p=0.45; Klf4=0.20; c-myc p=0.73). Expression values are normalized to GAPDH. D: In vitro tube formation of DsRed-LLCcm cells. Scale bar: 200 µm.
