Figure 2.

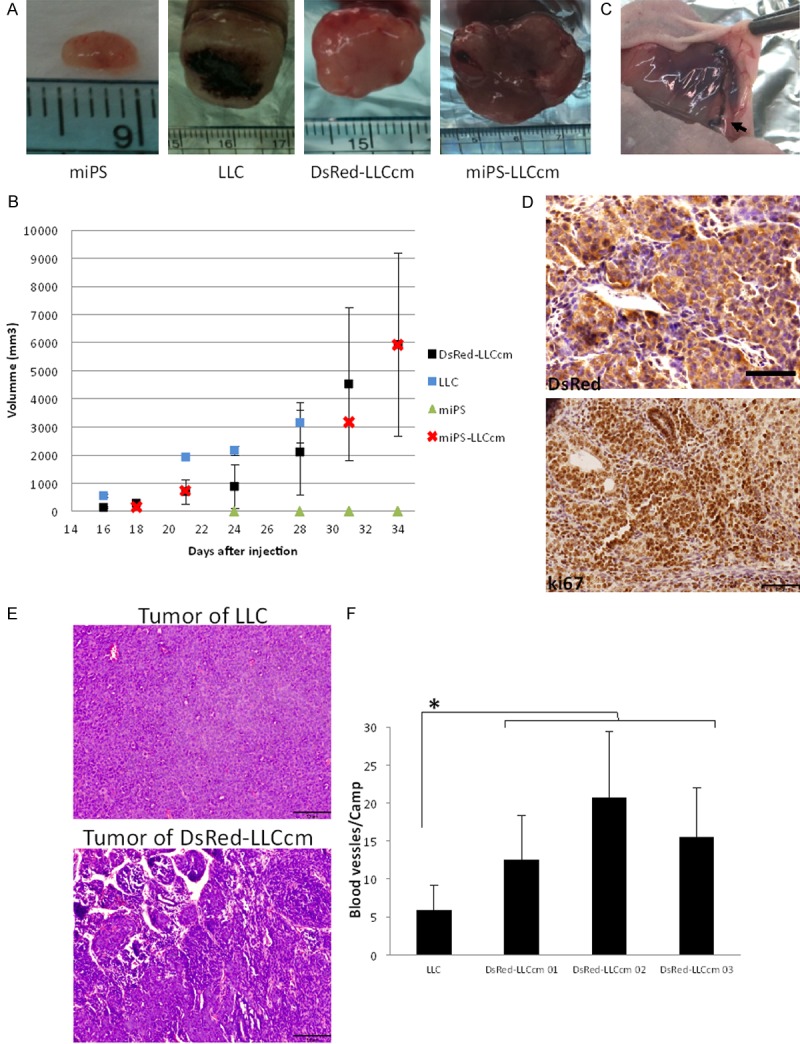
DsRed-LLCcm cells form malignant and highly angiogenic tumor in vivo. A: Images of tumors formed by indicated cells. B: Growth rate of tumors. LLC (n=2), DsRed (n=4), miPS (n=3), miPS-LLCcm (n=1). C: A typical image of blood vessels surrounding the tumor of DsRed-LLCcm. D: Immunohistochemistry of DsRed (upper panel) and Ki67 (lower panel) of tumor derived from DsRed-LLCcm cells. Scale bar: 50 µm. E: Hematoxylin-Eosin staining images of LLC and DsRed-LLCcm derived tumor. Scale bar: 100 µm. F: Blood vessel density of LLC and DsRed-LLCcm derived tumor. Random camps (n=15) were pictured and all the channels that contained red blood vessels were counted. *P<0.05.
