Figure 3.

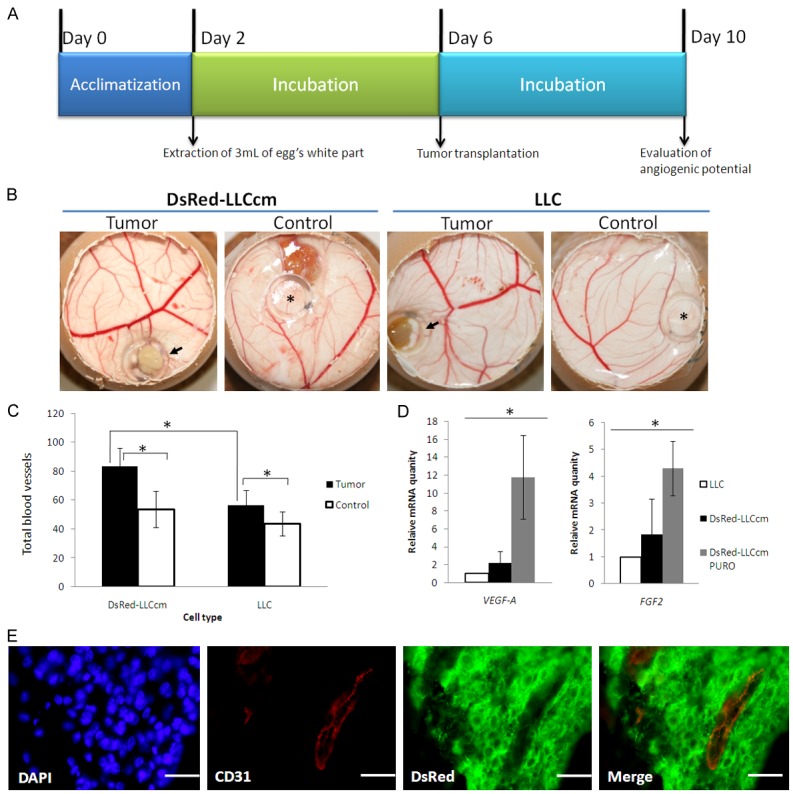
Angiogenic properties of DsRed-LLCcm cells. A: Experimental scheme of CAM assay. On day 6, a piece of freshly isolated tumor was added on the CAM, and on day 10, the pictures were taken and results analyzed. B: Typical results of CAM assay. C: Quantitative evaluation of blood vessel number in CAM assay. *p<0.05. D: Expression of VEGF-A and FGF2 in DsRed-LLCcm and DsRed-LLCcm selected with puromycin in comparison to LLC cells were quantified by RT-qPCR. Expression values are normalized to GAPDH. *p<0.05. E: Immunofluorescence analysis using CD31 (red)- and DsRed (green)-antibodies in tumors derived from DsRed-LLCcm cells. Scale bar: 25 µm.
