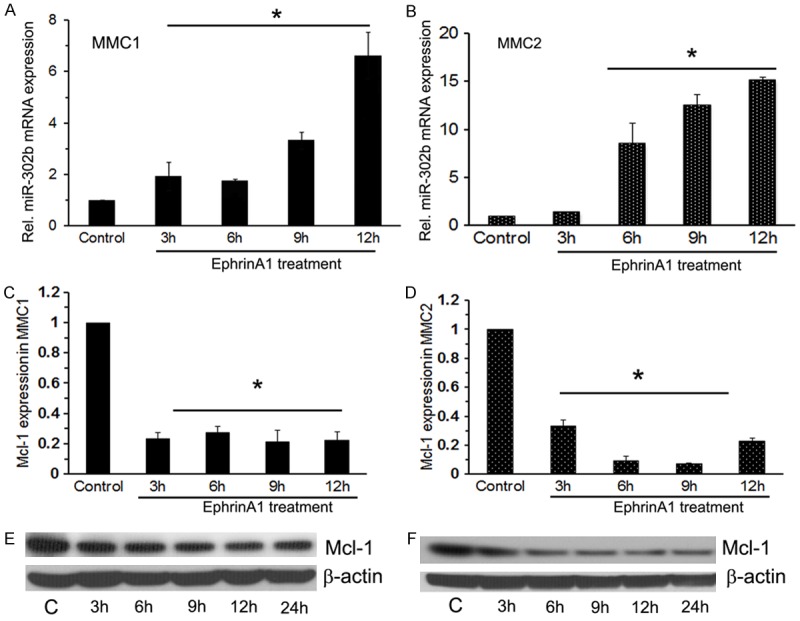
Figure 1.

Ephrin-A1 treatment induced miR-302b expression in MM cells in vitro. A and B. Represents miR-302b expression in MMC1 and MMC2 respectively for indicated time points. Data presented as relative expression values using control (Resting MMCs in medium without ephrin-A1 treatment) as the baseline value. Presented data are the mean of three separate observations. To normalize the expression of miR302b, we used 18S RNA as endogenous control. Ephrin-A1 treatment down regulates Mcl-1 mRNA and protein level in MM cells. C and D. Mcl-1 mRNA expression in MMC1 and MMC2. E and F. Western blot analysis of MMC1 and MMC2 subjected to ephrin-A1 treatment at different time points as indicated for determination of Mcl-1 expression. The β-actin was detected to demonstrate equal sample loading. All experiments were performed 3 times separately and data is represented as ± SEM, and values *P < 0.05 as compared to control.
