Figure 2.

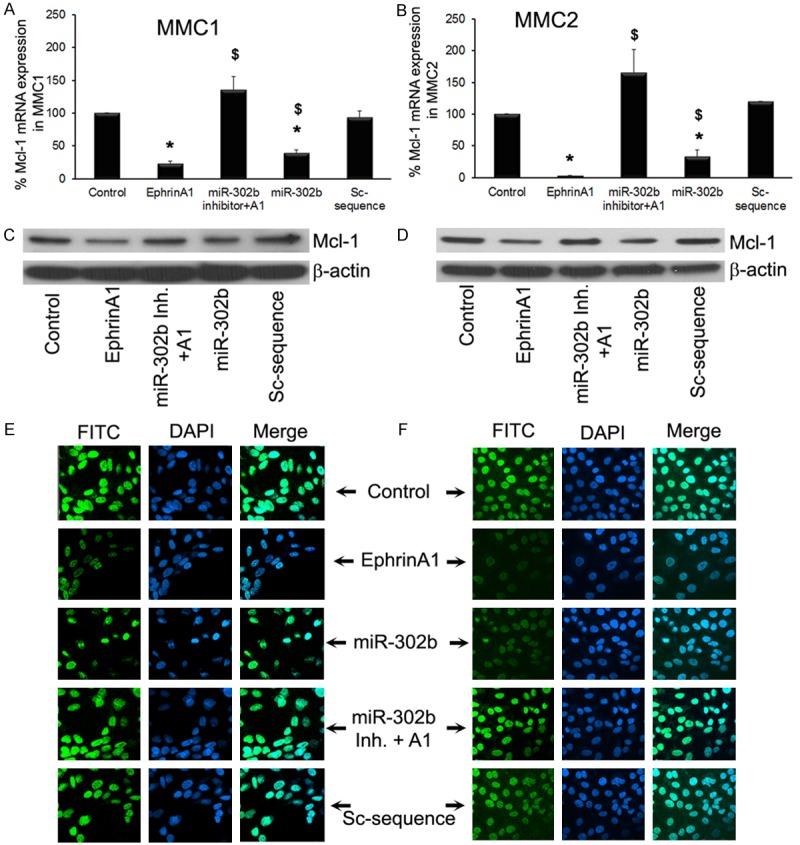
miR-302b synthetic inhibitor blocked ephrin-A1-mediated inhibition of Mcl-1 expression in MMCs. MMCs were transfected with or without miR-302b and miR-302b inhibitor and subsequently treated with ephrin-A1 as described earlier. Mcl-1 mRNA expression (A and B), and protein expression was determined in MMCs subjected to various treatments. The β-actin was detected to demonstrate equal sample loading (C and D). Cellular distribution of Mcl-1 in indicated treatments was analyzed by immunofluorescence microscopy (E and F). The green color represents Mcl-1 expression as stained by FITC, and DAPI was used as nuclear stain (blue color). All experiments were performed 3 times separately and data is represented as ± SEM, and values *P < 0.05 as compared to control; and $P < 0.05 as compared to Sc-sequence.
