Figure 1.

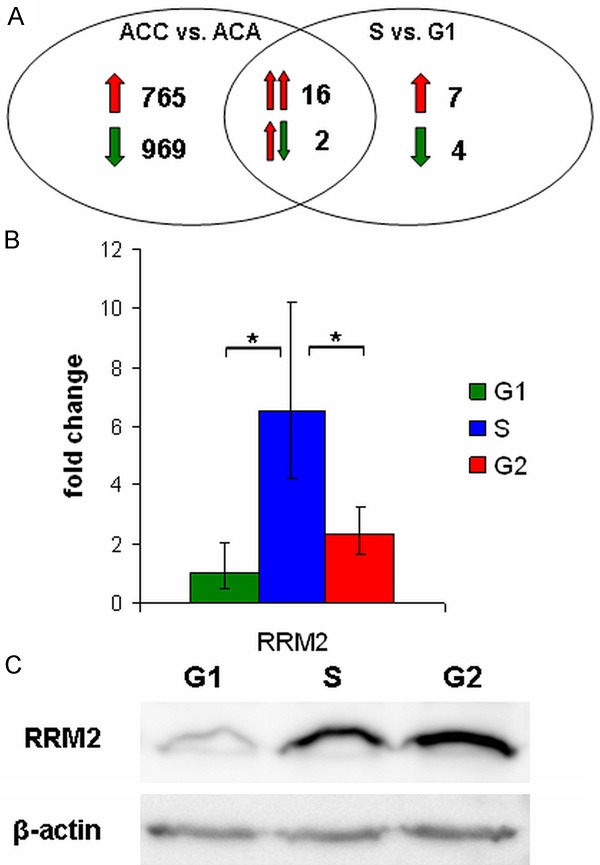
Cell cycle dependent expression of RRM2. A: Venn diagram displaying the overlap of the malignancy signature and the cell cycle regulated transcriptional program of ACC. Red arrows represent up-regulation, green arrows represent down-regulation in ACC vs. ACA and S vs. G1 comparisons. Double arrows represent expression alterations between ACC vs. ACA (left arrow) and S vs. G1 phase (right arrow) in the intersection. For gene list of the overlap genes see Table 2. B: qRT-PCR validation of cell cycle regulated RRM2. ΔCt value was normalized to G1 phase (ΔΔCt) and was subjected to FC = 2-ΔΔCt transformation. Error bars show standard deviation. Asterisks mark statistical significance (P<0.05). C: Western blot analysis of cell cycle regulated RRM2. β-actin was used as loading control.
