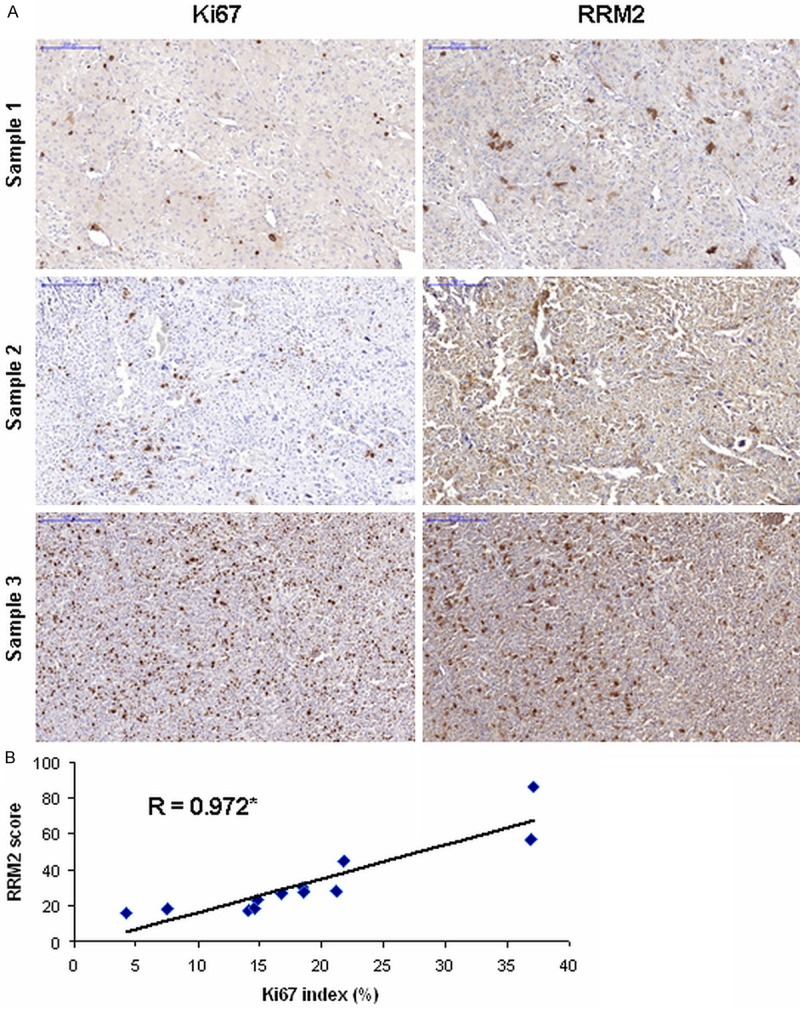
Figure 2.

Immunohistochemical analysis of Ki67 and RRM2. A: Representative slides of immunohistochemical analysis of Ki67 (left column) and RRM2 (right column) on the same area of three different ACCs. Blue scale corresponds to 200 μm, magnification is ×100. B: Correlation of Ki67 index and RRM2 score. Spearman’s correlation coefficient is shown. Asterisk marks statistical significance (P<0.005).
