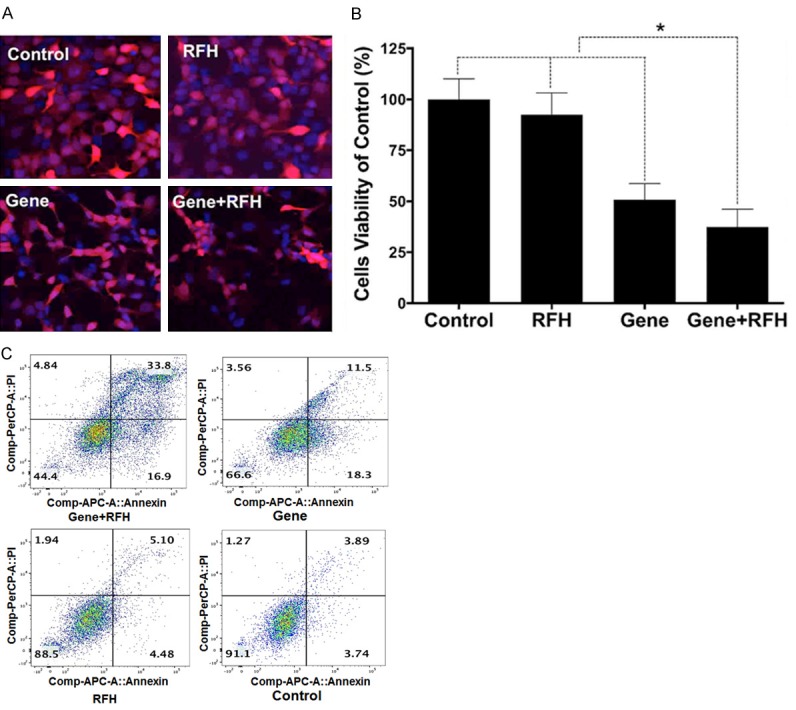
Figure 1.

A. Confocal microscopy shows a lowest number of cells survived in combination treatment (Gene+RFH). B. Results of MTS assay show that the lowest cell viability in the group receiving combination treatment (Gene+RFH), compared with those of control groups (*P<0.05). C. Apoptosis analysis shows much more apoptotic and necrotic cells in combination therapy group (Gene+RFH), compared to that of three control groups.
