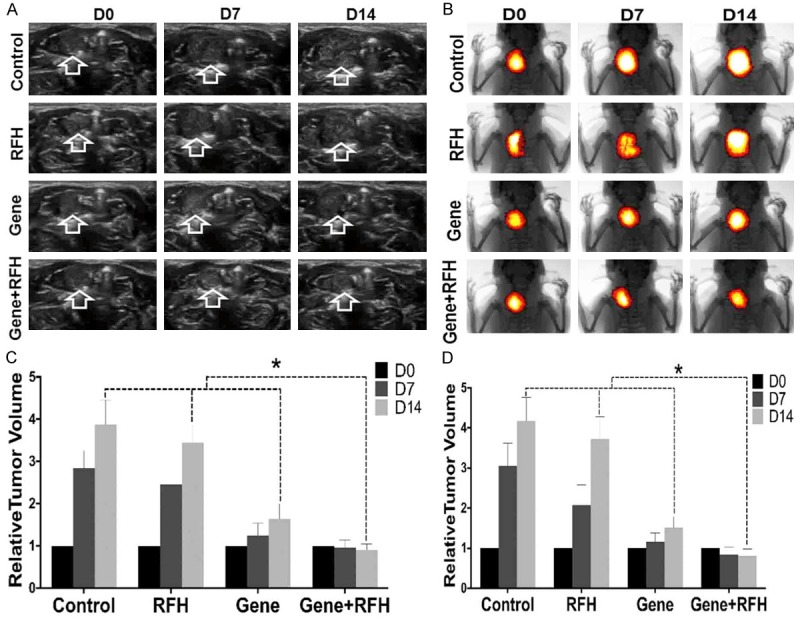
Figure 2.

Ultrasound imaging (A) and Optical/x-ray imaging (B) follow-up of rat esophageal cancers (arrows on A and yellow-red colors on B) in four different animal groups with various treatments. (C) Quantified analysis shows the significant decreased relative tumor volume in the combination therapy group (Gene+RFH) at day 14, compared with those of other three control animal groups, which is consistent with the drop of photon intensities on optical images (D).
