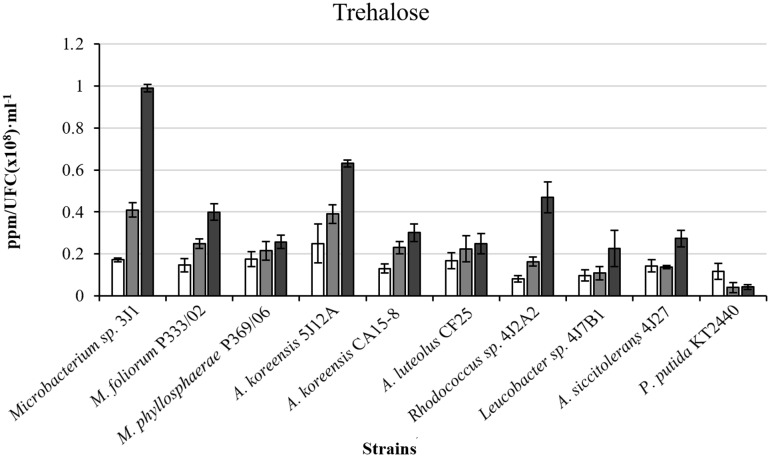
FIGURE 4.
Intracellular trehalose production in ppm/UFC (×108)⋅mL-1 by bacterial strains in different polyethylene glycol (PEG) concentrations. White bars correspond to cultures in the absence of PEG (0% PEG); gray bars, correspond to cultures supplemented with 5% PEG; and black bars, to cultures supplemented with 50% PEG. P. putida KT2440 was used as the control strain. Values are the means of three replicates ±SD.

