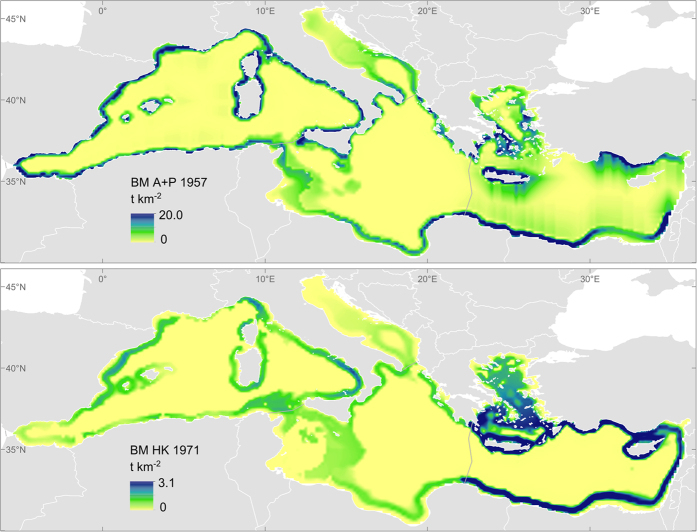
Figure 1. Preliminary results for one single year from the Ecospace (spatial) module as an example of the distribution of indicators.
BM A+P: Biomass of European anchovy + European pilchard, indicator of the capacity of food provisioning. BM HK: Biomass of European hake, indicator of the capacity of food provisioning. The temporal trends for all the indicators (biomass, catch and trophic level of catch) are estimated by the EwE model at sub-basin level. Maps generated with ArcGIS 10.2.2 for desktop (http://www.esri.com/software/arcgis).

