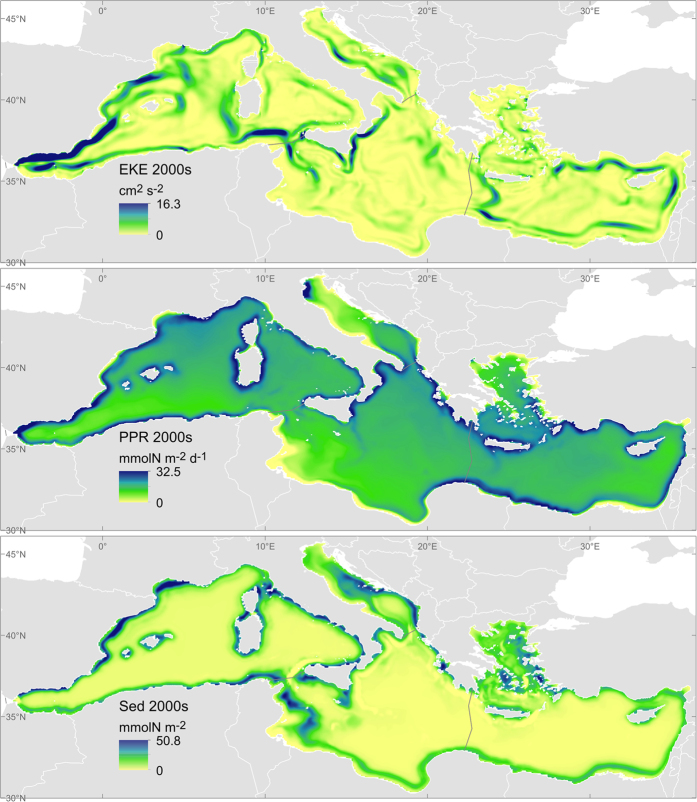
Figure 2. Distribution of the water purification indicators for the last available period, 2000–2010.
EKE: Kinetic energy of surface currents, indicator of the capacity of water purification. PPR: Primary production, indicator of the short-term flow of water purification. Sed: Burial of organic matter into the sediments, indicator of the long-term flow of water purification. Maps generated with ArcGIS 10.2.2 for desktop (http://www.esri.com/software/arcgis).

