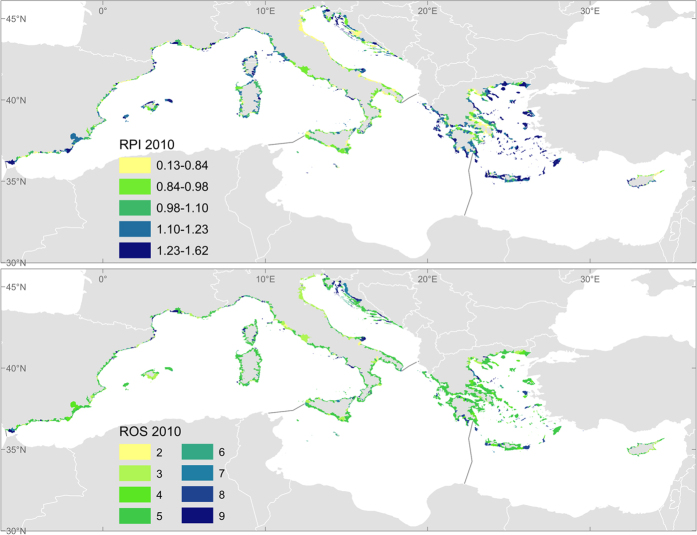
Figure 5. Distribution of the coastal recreation indicators for the last available period, 2010.
RPI: Recreation potential index, indicator of the capacity for nature-based recreation. ROS: Recreation opportunity spectrum, indicator of the flow of recreation (2 is the minimum and 9 the maximum flow, see legend in Supplementary Table S5). Maps generated with ArcGIS 10.2.2 for desktop (http://www.esri.com/software/arcgis).

