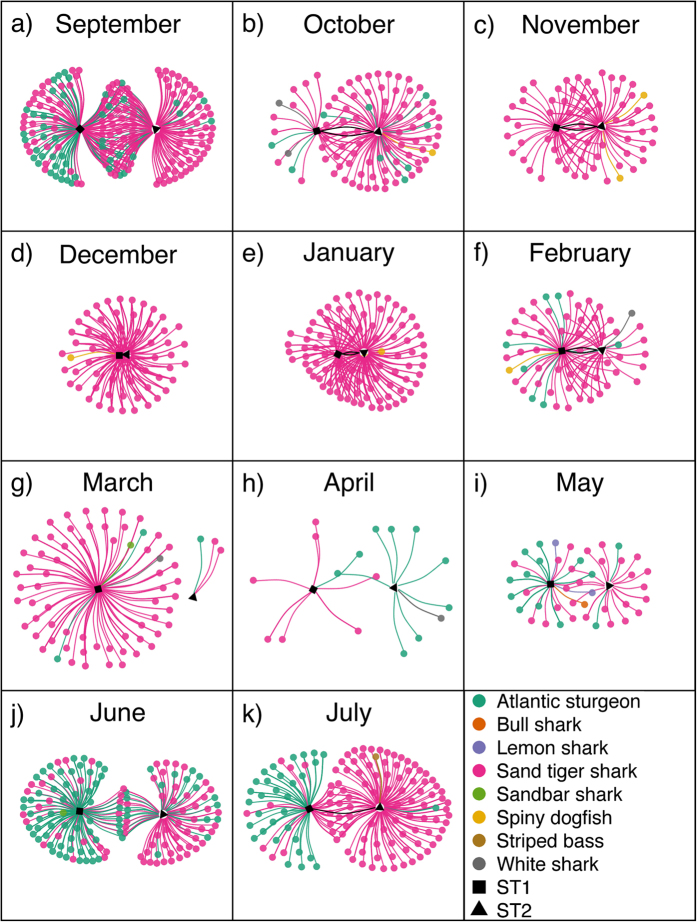
Figure 2. Heterospecific network graphs showing individuals encountered by sand tigers Carcharias taurus ST1 and ST2 from September 2012 to July 2013.
Points connected only to ST1 (■) were only encountered by ST1 during each month. Points connected only to ST2 (▲) were only encountered by ST2 during each month. Points in the center were encountered by both ST1 and ST2 at some point during the month. Black lines connecting ST1 and ST2 represent co-encounters between ST1 and ST2.

