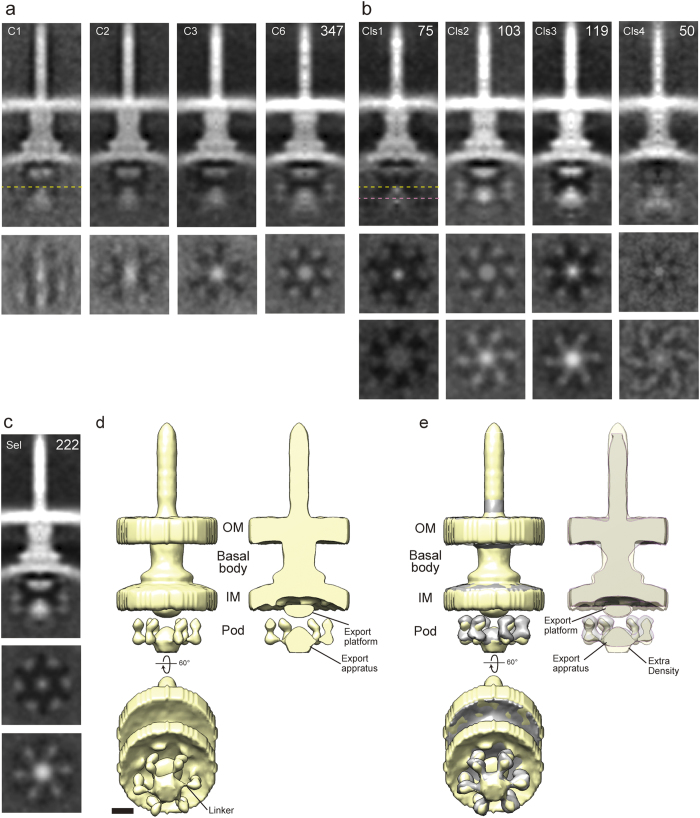
Figure 4. ECT subtomogram averaging map of Salmonella Typhimurium.
(a) central sections from the subtomogram averaging map of the NC in Salmonella with C1, C2, C3 and C6 symmetries, respectively and below each corresponding cross sections at height indicated by the dashed yellow line. (b) Central and cross section of four classes and middle/bottom each corresponding cross sections at height indicated by the dashed yellow line and the dashed pink line, respectively. The number of particles for each class is indicated in the top right corner. (c) Refined map excluding class 1 and 4, which show only weak densities in cytoplasmic region. (d) 3D surface rendering from in situ map of Salmonella showing NC and cytoplasmic regions. Below, the map inclined 60° to show the export apparatus, including extra density and linkers. Top right, a central section of the map. (e) Comparison of in situ maps of Shigella flexneri (grey) and Salmonella Typhimurium T3SSs (yellow). Below, the maps inclined 60° to show the export apparatus and linkers. Top right, overlay of central sections of these maps. Scale bar indicates 10 nm.

