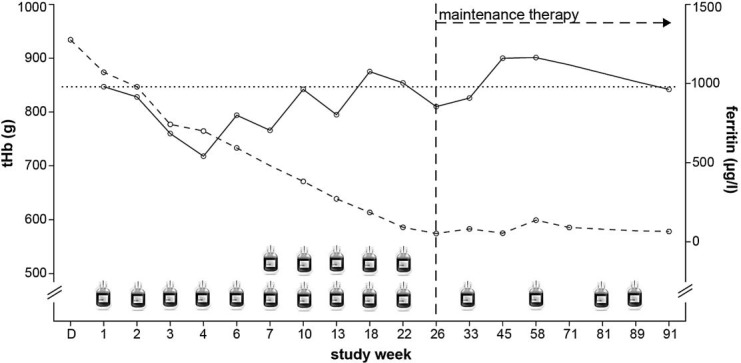
Fig. 1.

Time course of therapeutic phlebotomies, tHb and ferritin.  = Phlebotomy of 500 ml of whole blood; D = day of diagnosis; solid line = trend of tHb; dashed line = development of ferritin; horizontal dotted line = level of tHb before therapy; vertical dashed line = achieved therapeutic target of ferritin.
