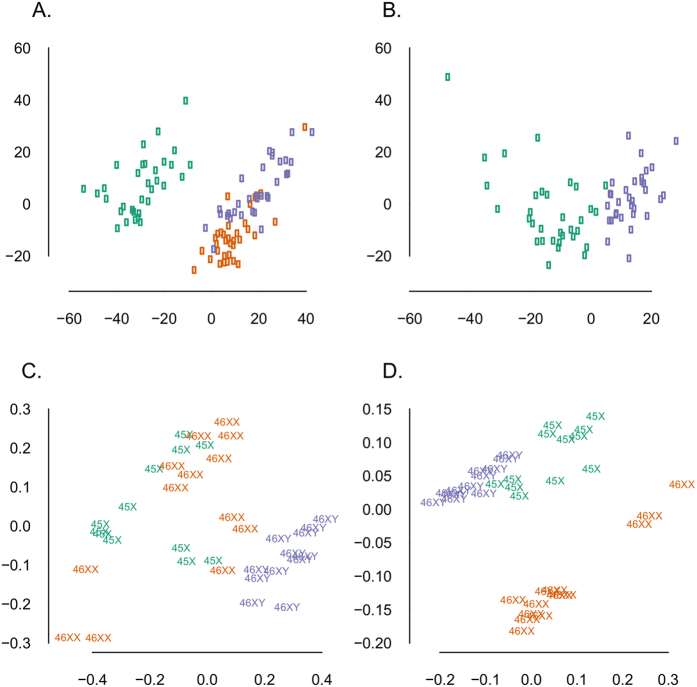
Figure 1.
(A,B) Multi-dimensional scaling plots (MDSplots) based on the 2-D projection of the Euclidean distances calculated between samples using the 5000 most variable CpG positions. (A) Autosomal methylation data and (B) X-chromosomal methylation data, both illustrating clear segregation according to the TS karyoype. Note that for X-chromosomal methylation data we only compare the one X-chromosome in TS with one of males (B). (C,D) MDSplots based on the biological coefficient of variation (BCV) derived from the expression data. (C) Autosomal expression data with no clear clustering. (D) X-chromosomal expression data showing clustering according to karyotype. Green = Turner syndrome; Purple = Male controls; Orange = Female Controls.

