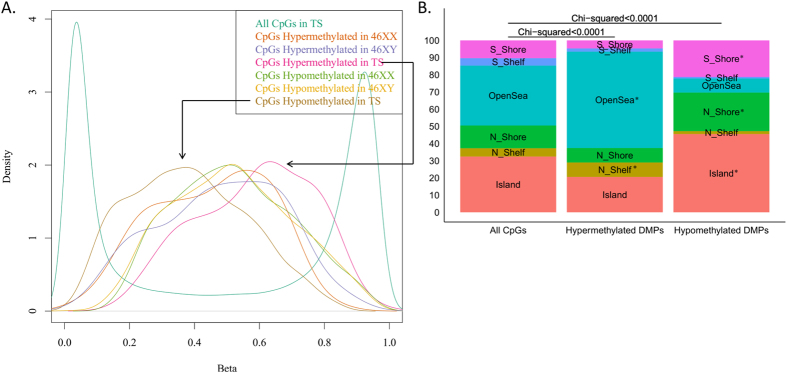
Figure 3.
(A) Distribution of methylation values in Turner syndrome showing the normal biphasic distribution of all CpGs (in green) with a spike close to zero and close to one. In comparison, methylation values corresponding to hypomethylated differentially methylated positions (DMPs) (purple) and hypermethylated DMPs (orange) in Turner syndrome showed nearly overlapping curves, approximately normally distributed, with median values at 0.37 and 0.62, respectively. Hence, most affected values show a medium level of methylation. (B) CpG island status of hypermethylated and hypomethylated DMPs were significantly different compared to all CpGs on the array. Enriched location are marked by “P < 0.0001” in plot.

