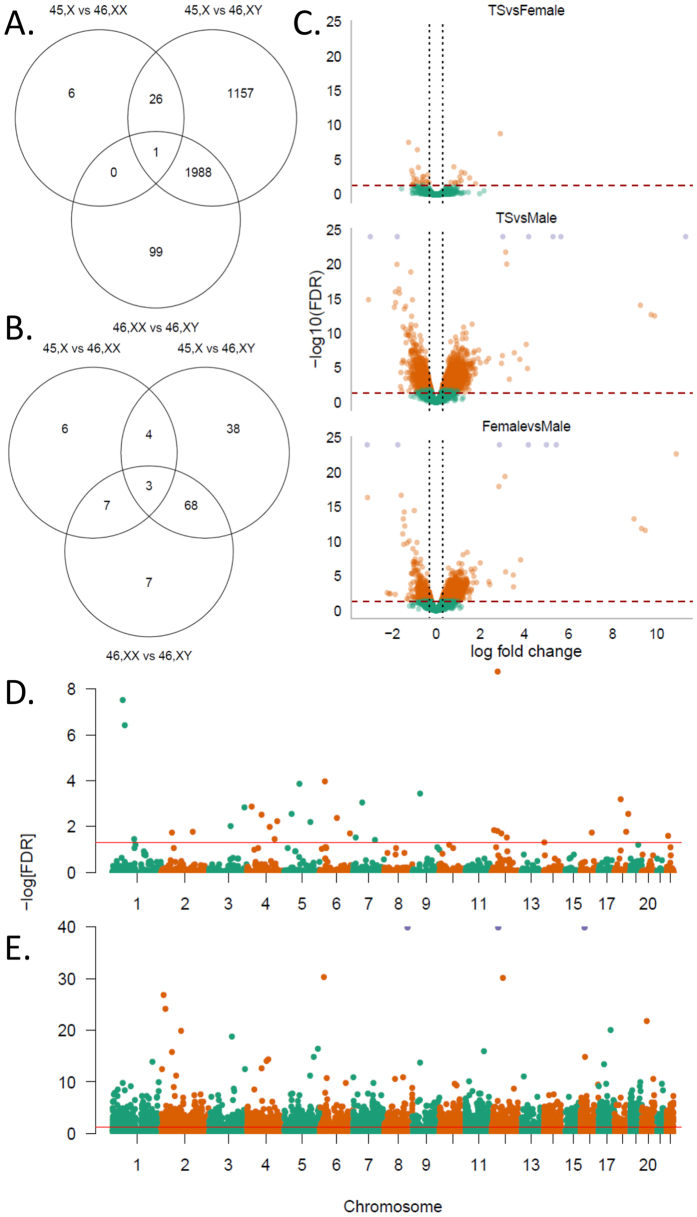
Figure 4. Plots are based on RNA-seq data and illustrate the global changes in gene expression affecting individuals with Turner syndrome.
(A) Venn diagram of autosomal genes. and (B) of sex-chromosomal genes. (C) Volcano plot of autosomal genes illustrating that differential expressed genes are both up and down-regulated. Orange dots are genes with an absolute log fold change ≥ 0.3 and FDR < 0.05. (D,E) Manhattan plot of autosomal genes from the Turner syndrome vs. females and Turner syndrome vs. males comparison with differential expression affecting close to all autosomes. Level of significance is set at Overall FDR and individual FDR < 0.05 and absolute log fold change ≥ 0.3.

