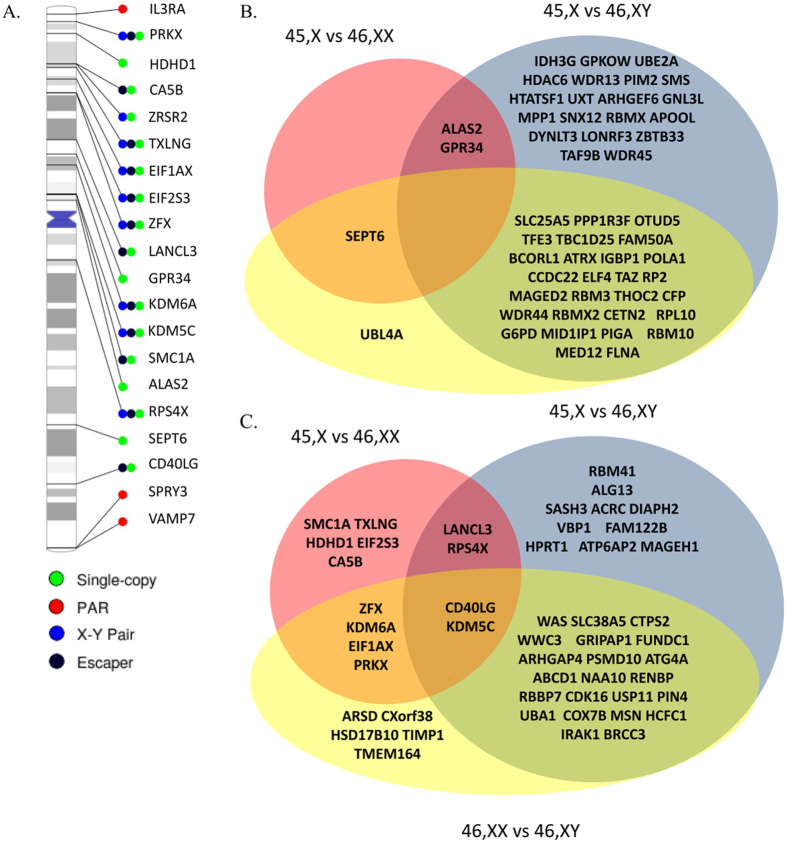
Figure 5.
(A) Differentially expressed X-chromosomal genes from the 45,X vs 46,XX comparison plotted corresponding to their location on the X-chromosome and with color coding according to status: Escape gene (black), Pseudo-autosomal (green). Single copy (red), and X-Y pairs (blue). Transparent red regions on the ideogram are the pseudo-autosomal region 1 and 2. Names are HGNC gene symbols. Plot illustrates that all differentially expressed genes were single copy genes or genes normally bi-allelic expressed with no multi-copy or ampliconic genes being differentially expressed. (B,C) Venn diagram listing differentially expressed X-chromosomal genes with Overall FDR < 0.05 and individual FDR < 0.05 and annotated as either inactivated (B) or as escape gene (C).

