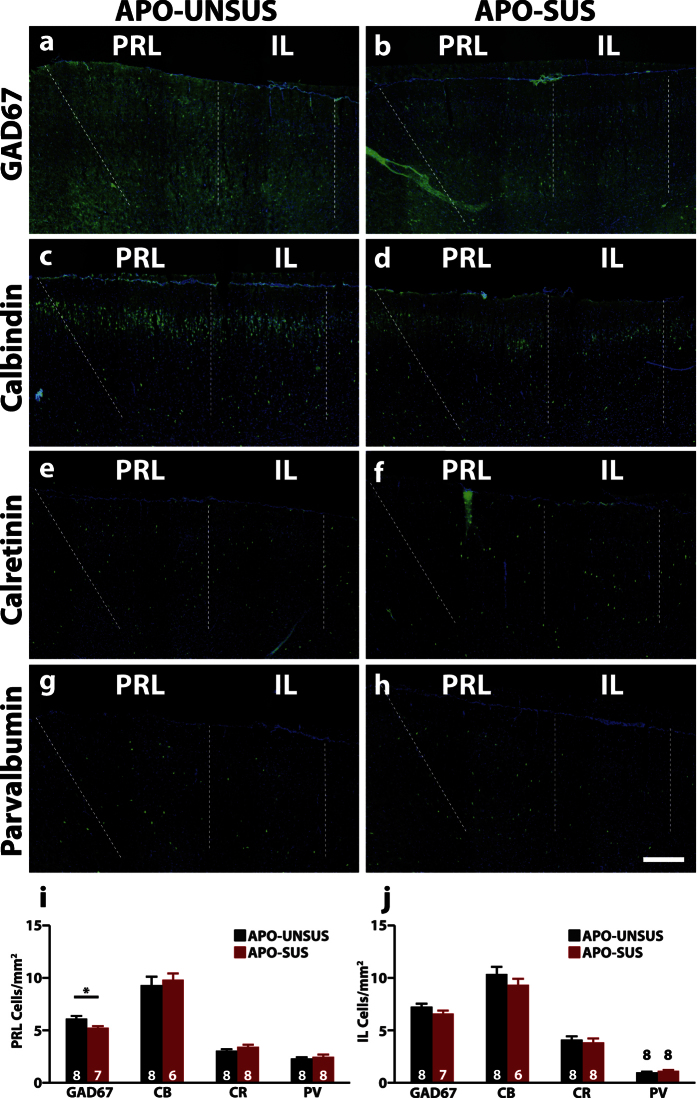
Figure 2. Reduced number of GAD67+ cells in the PRL, but not the IL.
Representative images of a staining for GAD67 (a,b), Calbindin (CB) (c,d) Calretinin (CR) (e,f) and parvalbumin (PV) (g,h) and quantification in the prelimbic (PRL) (i) and infralimbic (IL) region (j) of the medial prefrontal cortex. GAD67, CB, CR and PV staining in green, Hoechst in blue. Sample size (n) is indicated in the bars. Scale bar: 200 μm. Data is presented as mean ± SEM. **p < 0.01. Student’s t-test.

