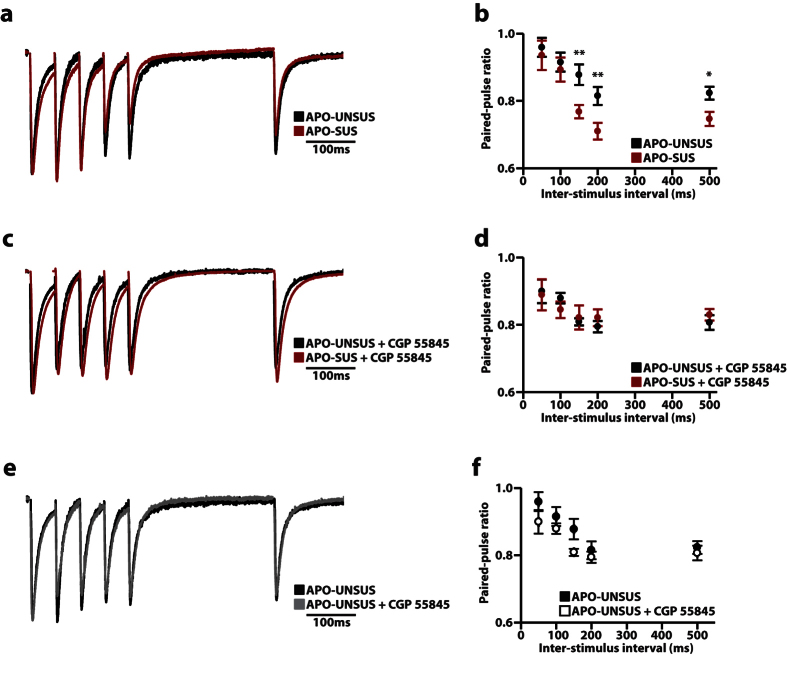
Figure 4. APO-SUS rats show a reduced paired-pulse ratio at long ≥ 150 ms inter-stimulus intervals (ISI).
(a,b) Representative traces (a) and quantification (b) of the paired-pulse ratio at different ISIs from APO-UNSUS (n = 14/3) and APO-SUS (n = 15/4) rats. (c,d) Representative traces (c) and quantification (d) of the paired-pulse ratio at different ISIs in the presence of the GABAB antagonist CGP 55845 from APO-UNSUS (n = 10/3) and APO-SUS (n = 12/3) rats. (e,f) Comparison between APO-UNSUS in the absence or presence of CGP 55845, note that these traces are the same as in a–d. Representative traces show an overlay of all 5 individual inter-stimulus intervals. Sample size (n) is shown as number of cells/number of animals. Data are presented as mean ± SEM. *p < 0.05; **p < 0.01. Student’s t-test with Holm-Sidak correction for multiple comparisons.

