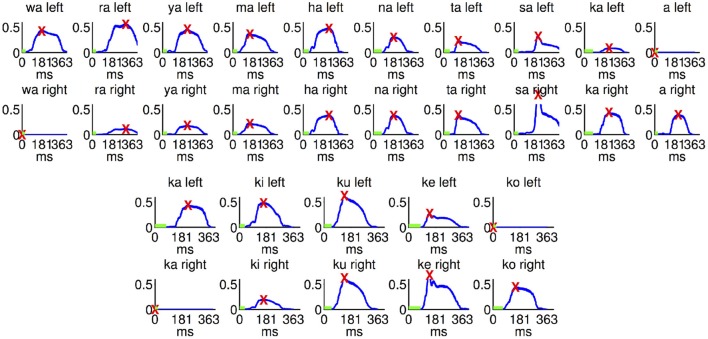
Figure 5.
The wave forms of the sound stimuli used in the current study. We took the absolute values of the signals and smoothed them with a 1000 sample moving average. These curves are shown in blue for the right and left channel for each stimulus used. Maximum peaks are marked with a red “X.” Periods with less than 1% of the maximum amplitude are marked with a green bar. The column stimuli are shown in the top two rows and the row stimuli in the bottom two rows.

