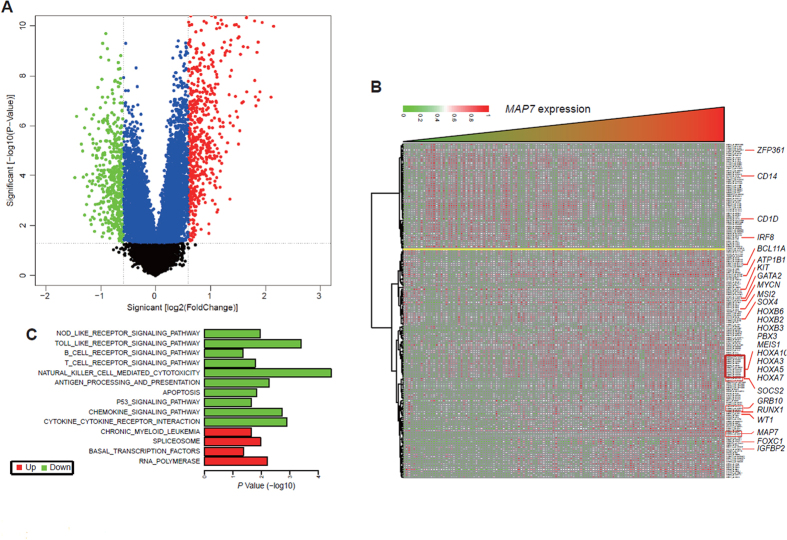
Figure 3. Genome-wide gene expression profile and cell signaling pathways associated with MAP7 expression is shown.
(A) Volcano plot of differential gene expression; MAP7high and MAP7low were marked by red and green circles, respectively; (B) Expression heat map of associated genes; (C) Cell signaling pathways.

