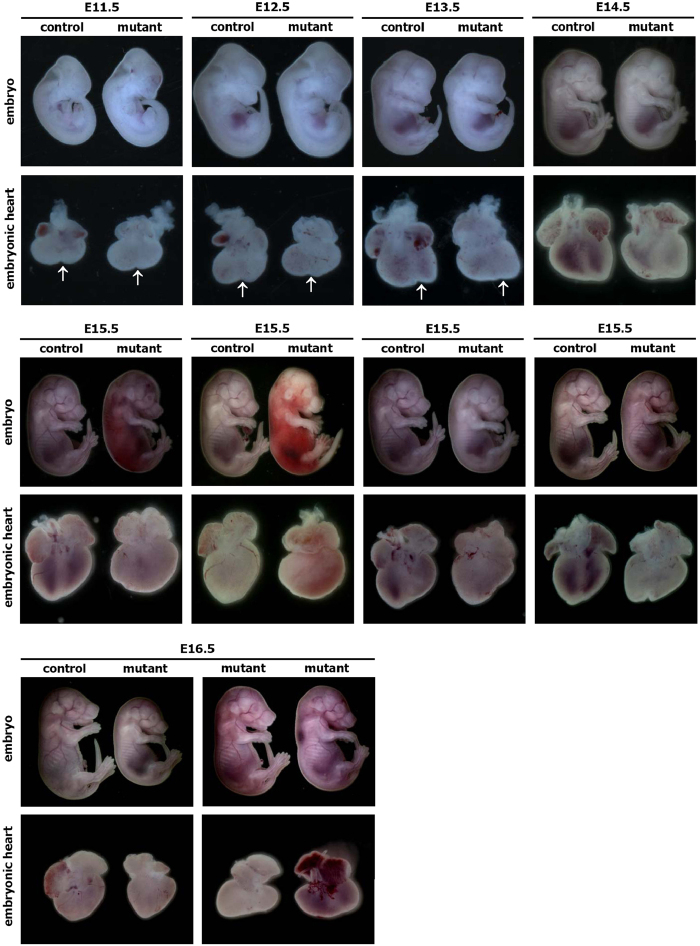
Figure 3. Whole-mount views of representative hearts obtained from control (EIIa-Cre) and mutant (RCLG/EIIa-Cre) embryos at E11.5 to E16.5.
The lower images show the hearts of the E11.5 to E16.5 control and mutant embryos shown in the upper images. At E14.5, E15.5 and E16.5, all of the mutant embryos exhibiting hemorrhages, a pale body surface or no abnormal appearance displayed abnormal heart morphology. The arrows indicate the interventricular sulcus.

