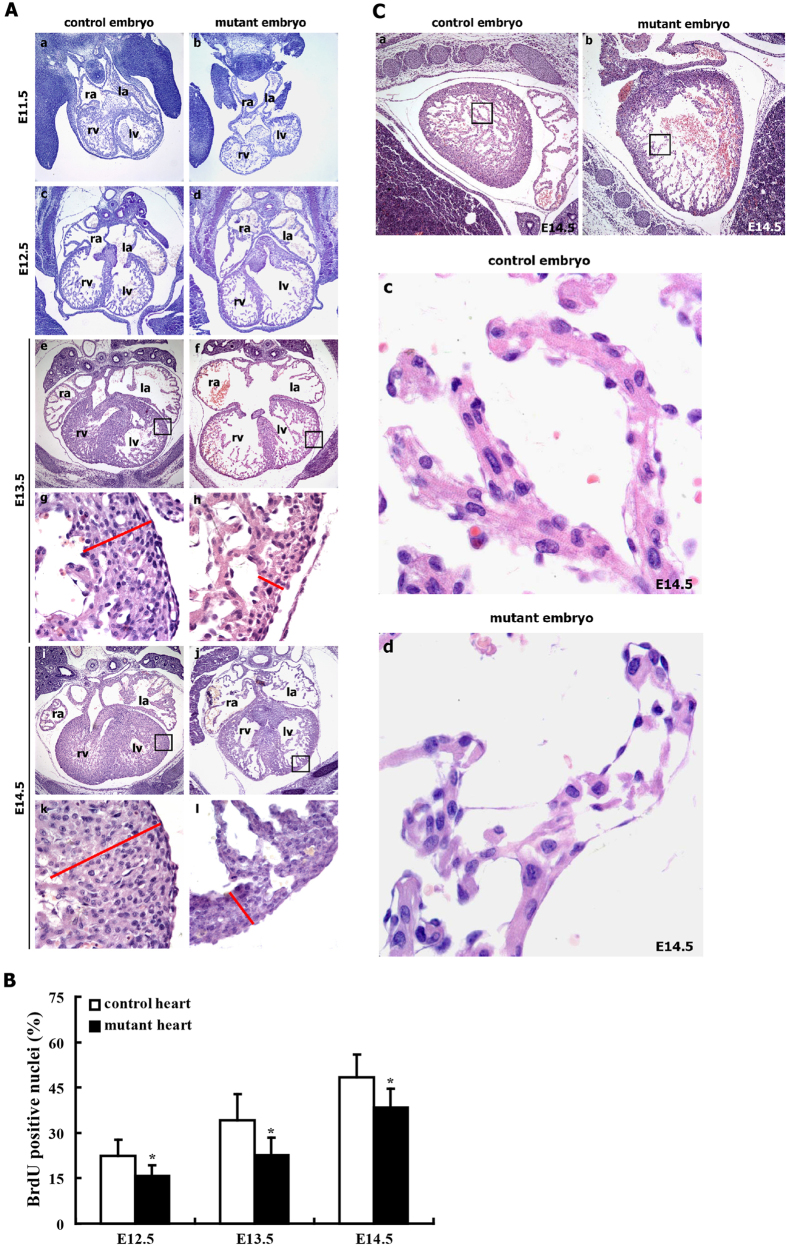
Figure 4. Cardiac defects in mutant embryos (RCLG/EIIa-Cre).
(A) H&E staining of transverse sections of control and mutant embryos. The upper images show the entire hearts of E13.5 and E14.5 embryo, and the lower images (g,h,k,l) are higher magnifications of the rectangular regions indicated in images (e,f,i,j), respectively. Higher magnification of E13.5 and E14.5 hearts revealed thinning due to a decrease in the myocardial cell layers in mutant embryos. The red lines show the thickness of the myocardial layer of the left ventricle (lv). Abbreviations: ra, right atrium; la, left atrium; rv, right ventricle; lv, left ventricle. (B) The cardiomyocyte proliferation index was calculated by dividing the number of BrdU positive nuclei by the total number of nuclei in the E12.5, E13.5 and E14.5 mutant hearts. Representative BrdU staining of embryonic heart sections at E12.5-E14.5 is indicated in Supplementary Figure S16. (C) The cardiomyocytes in the mutant embryos failed to assemble striated myofibrils. (c,d) are higher magnifications of the regions indicated in (a,b), respectively.

