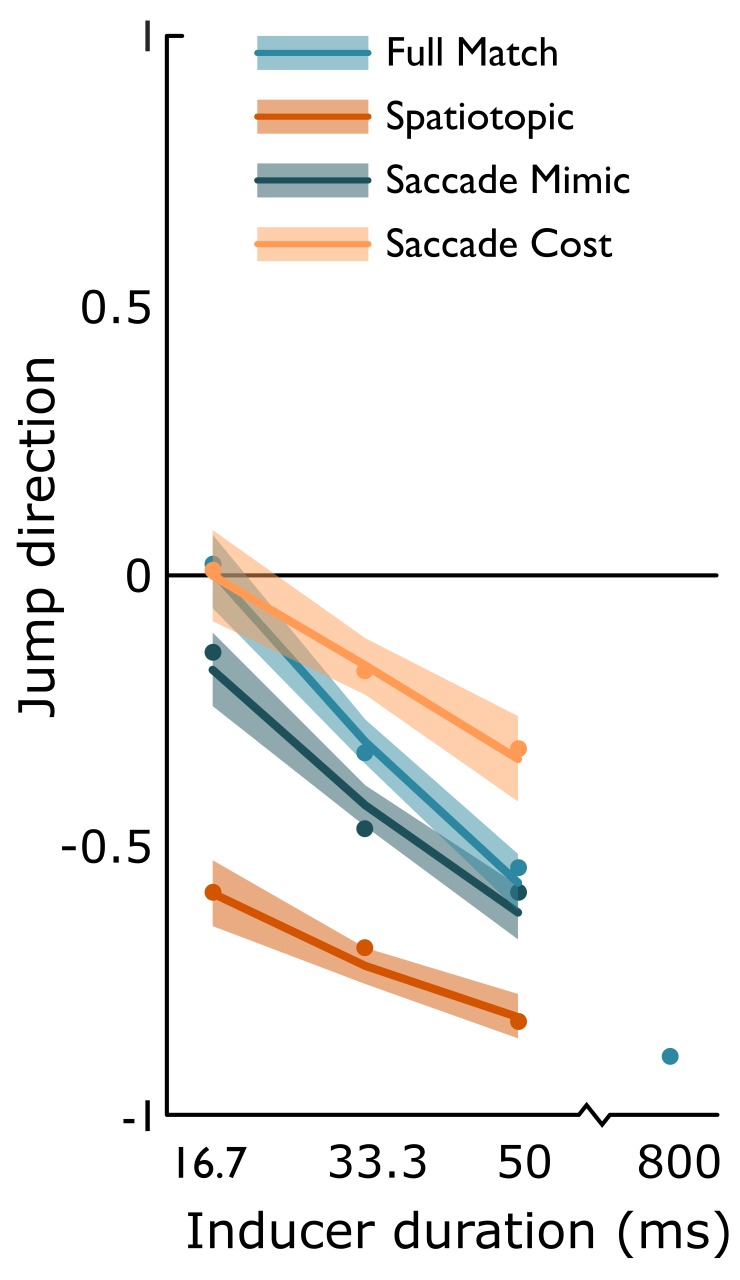
Figure 4. Perceived jump directions in Experiment 2.
Positive values represent forward jumps, negative values backward jumps. Lines depict linear interpolation between the estimates of the linear logit mixed effects model. Shaded region represents the bootstrapped 95%-confidence intervals of the model estimates. Bootstrapped averages are depicted by the small dots (N = 12). We observed the rapid induction of the illusion, as illustrated by the slope in the Full Match condition (light blue), similar to the Saccade mimic condition (dark blue). In the Saccade Cost condition, the illusion developed more slowly over time (light orange). In the Spatiotopic condition, the illusion was induced more strongly than in the Full Match condition, even when the transient was presented after only a single frame of the post-saccadic inducer (dark orange line). Similarly, in the Spatiotopic condition, the illusion was induced more strongly than in the Saccade Mimic condition (dark blue line), even when the transient was presented after only 16.7 ms of the post-saccadic inducer.

