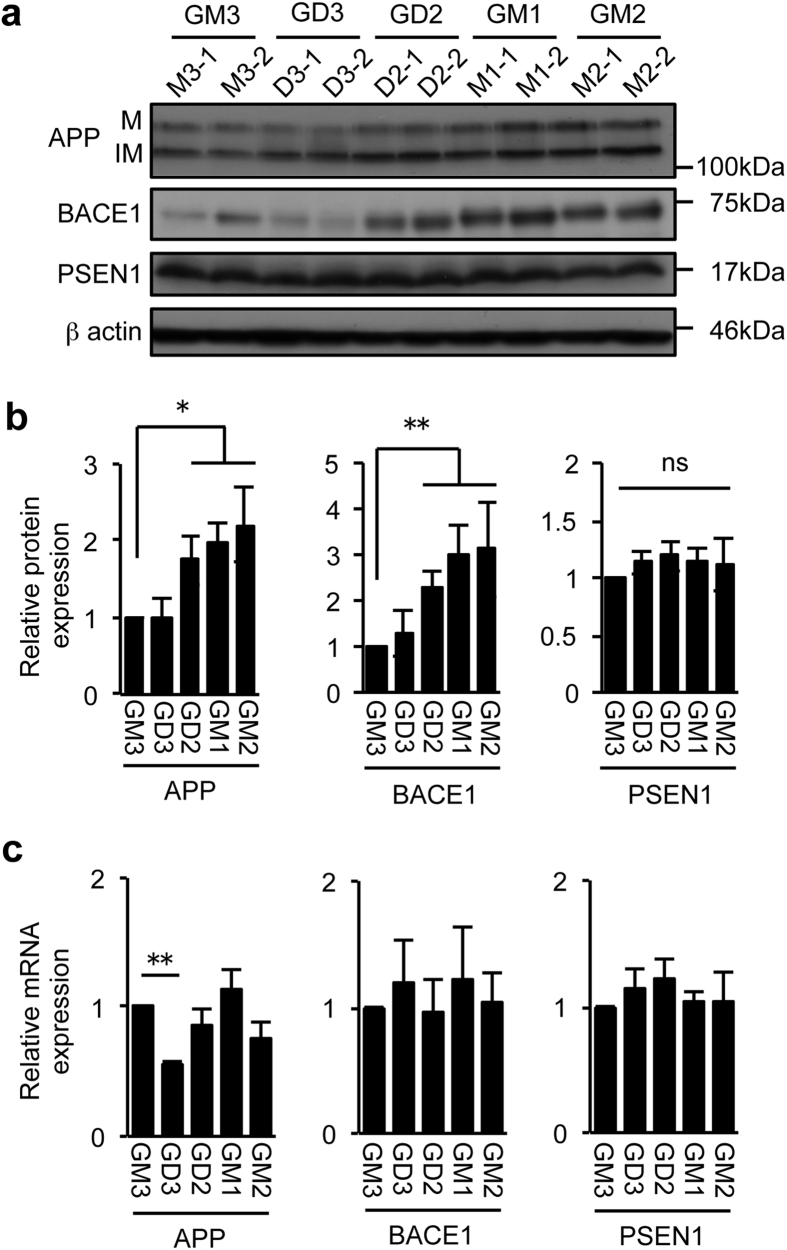
Figure 3. Expression of APP, BACE1 and PSEN1.
(a,b) Protein expression levels. Cell lysate was subjected to immunoblot analysis with antibodies to APP (22C11), BACE1, or PSEN1. The expression levels were quantified and plotted in panel b. Data shown are means ± s.d. (n = 6 for APP and PSEN1, n = 8 for BACE1). Statistical analysis was performed by one-way ANOVA with Tukey-Kramer (APP and BACE1) or Dunnett (PSEN1) post hoc test. *P < 0.05, **P < 0.01. IM, immature form; M, mature form (c) mRNA expression. Levels of APP, BACE1, and PSEN1 mRNAs were analysed by quantitative RT-PCR as described in Methods. Data shown are means ± s.d. (n = 3 for APP and PSEN1, n = 5 for BACE1). Statistical analysis was performed by one-way ANOVA with Tukey-Kramer (APP) or Dunnett (BACE1 and PSEN1) post hoc test. *P < 0.05, **P < 0.01. ns; not significant.

