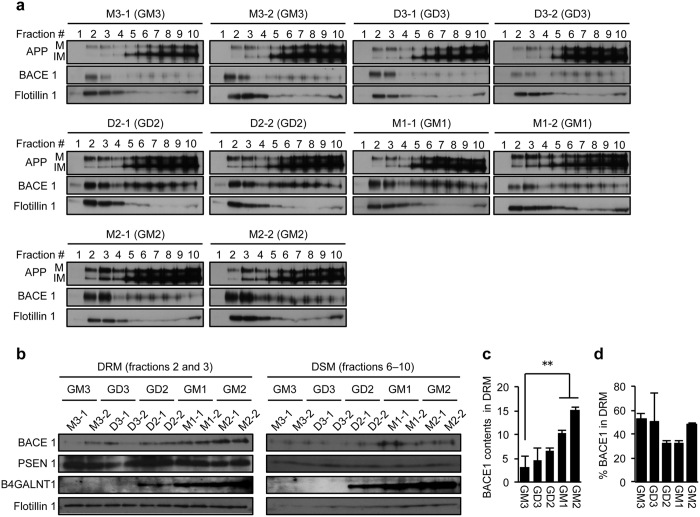
Figure 7. Abundance of BACE1 protein in detergent-resistant membrane domains.
(a) Distribution of APP and BACE1 in DRM and DSM. Cells were treated with 1.0% Brij 98, and post-nuclear fraction was subjected to density gradient centrifugation as described in Methods. Equal volume from each fraction was subjected to immunoblot analysis to examine the distribution of APP, BACE1, and flotillin-1. IM, immature form; M, mature form. (b) Levels of APP, BACE1, PSEN1, and B4GALNT1 in DRM and DSM fractions. Equal amounts from fractions 2 and 3 (DRM) or 6–10 (DSM) were subjected to immunoblot analysis. (c) BACE1 contents in DRM. Relative BACE1 contents in DRM were quantified by setting M3-1 cells at 1 based on the result of panel b. BACE1 levels were normalized by flotillin 1 expression in DRM. Data represent means ± s.d. (n = 4). **P < 0.01 by one-way ANOVA with Tukey-Kramer post hoc test. (d) Relative BACE1 distribution. % BACE1 in DRM was quantified by the following equation: (BACE1 in DRM)/(BACE1 in DRM and DSM) × 100. Data represent means ± s.d. (n = 4). Statistical analysis was performed by one-way ANOVA with Dunnett post hoc test, and statistical significance was not detected.

