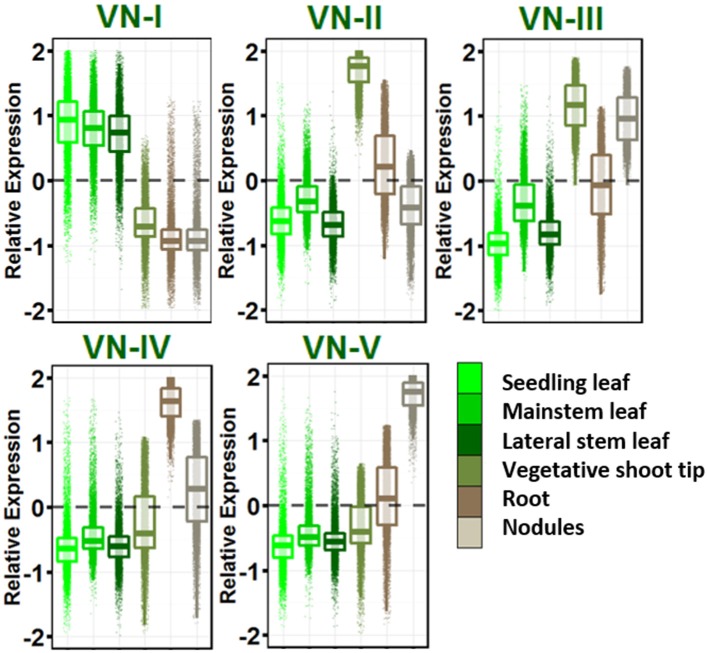
Figure 2.
Vegetative gene networks. Relative expression is Z-score transformed FPKM. Plots are jigger boxplots with every gene's normalized gene expression shown in the plot. Boxplot is traditional boxplot with median, and upper and lower quartiles. Each tissue is colored as in key to right in the same order.

