
Figure 3.
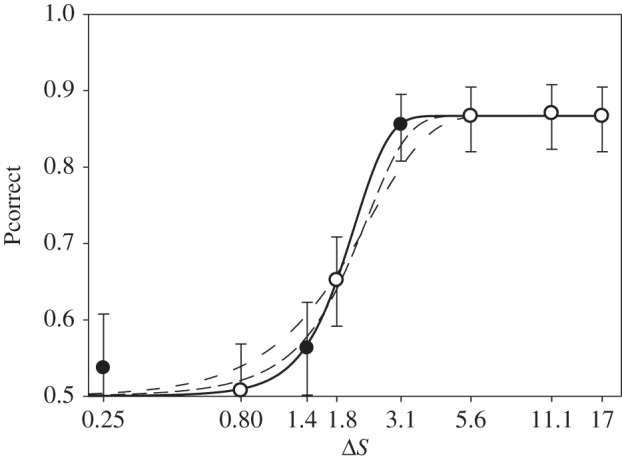
Proportion of correct choices, Pcorrect, as function of colour distance, ΔS. The data for all fish are pooled. Filled circles correspond to direction S, open circles correspond to direction T. Error bars indicate 95% CIs (binomial test). The colour distance is plotted on a logarithmic scale. Solid line is the theoretical psychometric function that gives the best fit for the ideal observer model (t = 2.85), as described in Vorobyev et al. [21]. The thin lines show the psychometric functions for t = 1 and 2—where t is the response criterion which must be exceeded to detect a stimulus and the threshold of discrimination is taken as 75% correct choices.