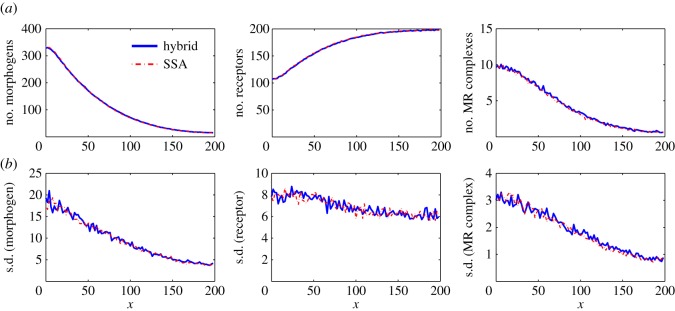
Figure 4.
Simulation results for example II. (a) Means of the numbers of morphogens, receptors and morphogen–receptor complexes. (b) The corresponding standard deviations. In the results, 200 simulations were used to calculate the statistical quantities for each case. In this simulation, we take DM= 5 μm2 s−1 and the remaining parameters are listed in table 1.

