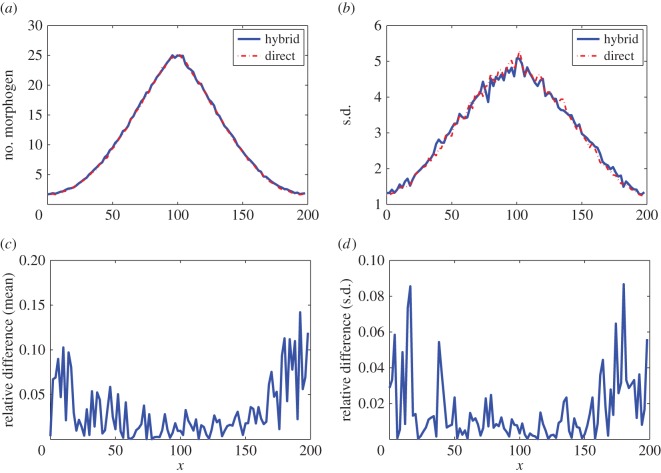
Figure 7.
Simulation results for example V in which the morphogen production region is located at the centre of the domain. In the results, 500 simulations were used to calculate the statistical quantities for each case. The parameters are listed in table 1 and DM=40 μm2 s−1. (a) Means of the number of morphogens. (b) Standard deviations of the number of morphogens. (c) Relative differences of means for the simulations by the SSA and the hybrid method. (d) Relative differences of standard deviations for the simulations by the SSA and the hybrid method.

