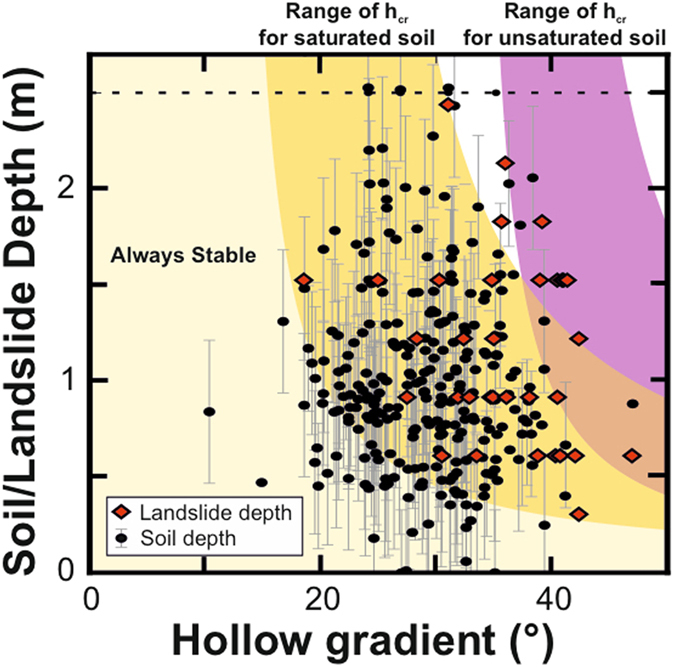
Figure 2. The distribution of Appalachian colluvium and landslide depths.

Appalachian colluvial hollow depth data (black circles) as a function of hollow gradient, with error bars to show the standard deviation of uncertainty (Methods). Colluvial landslide depths (red diamonds) and hollow gradients attained from the North Carolina landslide database, measured in the field and accurate to the nearest 30 cm (1 foot)4. For each plot, we show the interquartile range of predicted critical colluvium depths based on random samples of slope, root and soil cohesion, soil friction angle, and saturated weights of soil. Most of our samples plot within the range of saturated hcr, suggesting that they are close to the critical colluvium depth, with some being located in high cohesion hollows that are stable, while others in low cohesion hollows are unstable. To determine the proportion of hollows that may be above or below their local critical colluvium depth we calculated the hcr for the population of hollows by randomly assigning values for root and soil cohesion, soil friction angle, and saturated weights of soil. We then simulated the distribution of hollow depths relative to the critical colluvium depths 1000 times, to assess the potential error in this calculation.
