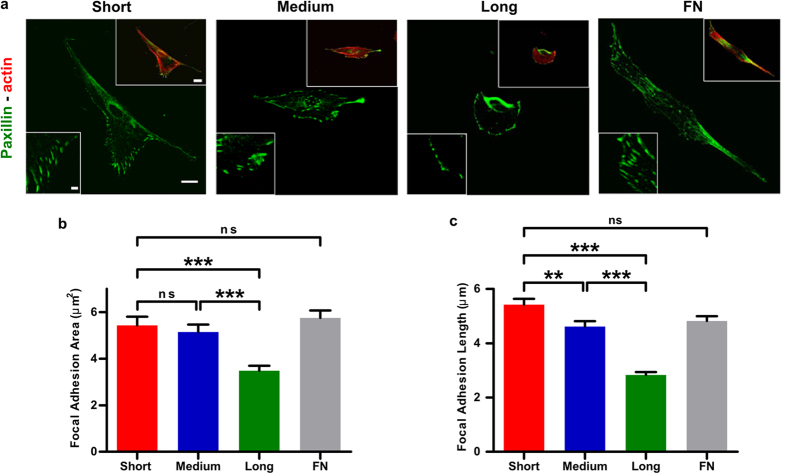
Figure 2. Adhesive ligand tether length affects the size and length of focal adhesions.
(a) Confocal microscopy images of cells stained for paxillin (green) and F-actin (red) on short, medium and long tethered surfaces and on fibronectin-coated glass (FN). Scale bars are 20 μm in main image and cell inset and 5 μm in FAs inset. (b) Quantification of focal adhesion length and area (n > 85 for each condition). Histograms represent mean ± sem.

