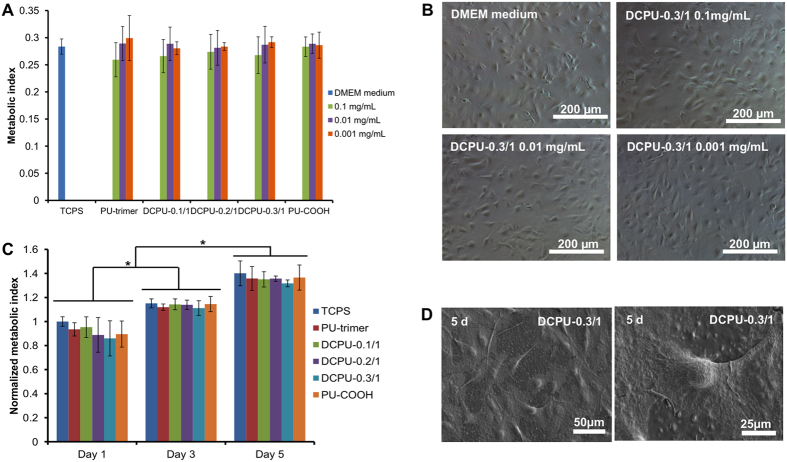
Figure 7. DCPU cytotoxicity and cytocompatibility.
(A) Metabolic index of mouse 3T3 fibroblasts cultured with DMEM medium mixed with DCPU degradation products at concentrations of 1, 0.1, 0.01 and 0.001 mg mL−1. (B) Optical microscopy images of mouse 3T3 fibroblasts cultured with DMEM medium mixed with DCPU-0.3/1 degradation products at concentrations of 0.1, 0.01 and 0.001 mg mL−1. DMEM medium was used as the control. (C) Metabolic index of mouse 3T3 fibroblasts seeded on polyurethane films (TCPS as a control) at days 1, 3 and 5. (D) Scanning electron micrographs of mouse 3T3 fibroblasts cultured on the DCPU-0.3/1 film at day 5 (500× and 1000× magnification). *Represented significant different groups (p < 0.05).

