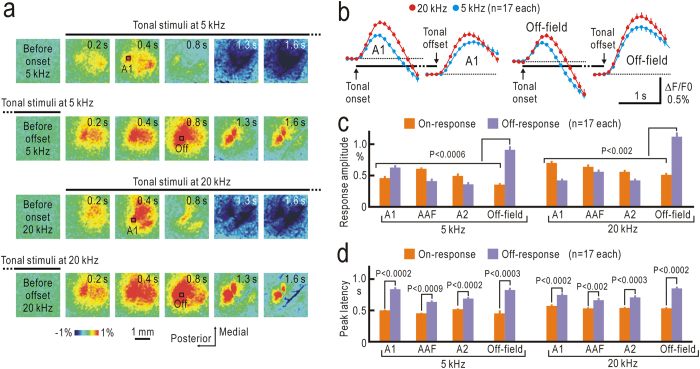
Figure 2. Flavoprotein fluorescence responses to tonal stimuli lasting for 7 s.
(a) On- and off-responses to 5 kHz (upper two panels) and 20 kHz stimuli (lower two panels). Clear off-responses were observed after offsets of stimuli. Time shown at each panel represents that after stimulus onset for on-responses (first and third lines of panels), and that after stimulus offset for off-responses (second and fourth lines). Lines above panels show timing of stimulus presentation. (b) Time courses of on- and off-responses in ROIs placed in A1 and the off-response field. (c,d) Amplitudes (c) and peak latency (d) of on- and off-responses in A1, AAF, A2, and the off-response field.

