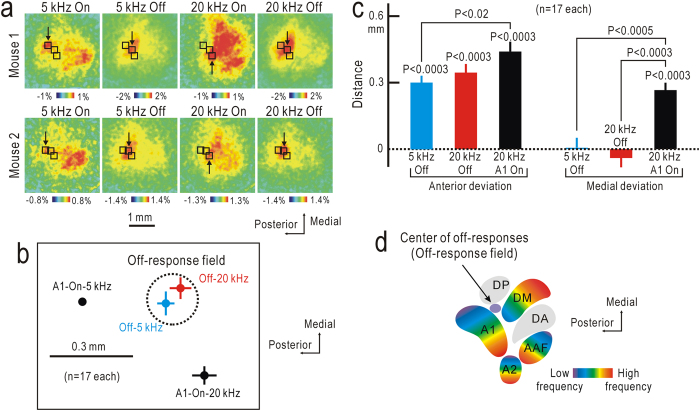
Figure 3. Cortical distribution of off-response peaks.
(a) On- and off-responses to 5 kHz or 20 kHz tonal stimuli lasting for 7 s recorded in the two different mice. (b) Locations of on- and off response peaks relative to on-response peaks to 5 kHz stimuli in A1. No significant tonotopic shift was found in the off-responses, while the on-response peaks were arranged in a tonotopic order within A1. (c) Anterior and medial deviations of 5 kHz off-, 20 kHz off-, and 20 kHz on-response peaks from the 5 kHz on-response peaks in A1. P values were estimated compared with the location of the 5 kHz on-response peaks in A1, unless otherwise specified. (d) Relative location of off-response field (purple) in the schematic map of the auditory cortex19,20. Tonotopically organized fields are shown in rainbow colors.

