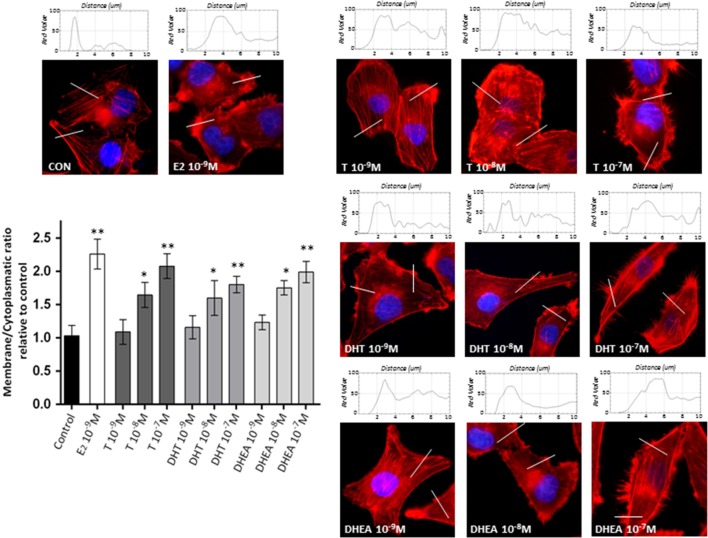
Figure 2.
Androgens trigger actin cytoskeleton and cell membrane remodeling in T47D cells. T47D cells were treated with E2 (10−9M) or with increasing concentrations of T, DHT, or DHEA (10−9M–10−7M) for 20 min. Actin filaments were stained with phalloidin linked to Texas Red (red staining), and nuclei were counterstained with DAPI (blue staining). Immunofluorescence analysis reveals the dynamic modifications of actin filaments localization and the formation of specialized cell membrane structures. The histograms represent the quantification of fluorescence intensity across the lines of 40 cells of each group using ImageJ software. Images are representative and the bar graph represents the mean ± SEM of the membrane/cytosol actin fluorescent intensity ratio relative to control of triplicate experiments (*p ≤ 0.05, **p ≤ 0.01 versus control).

