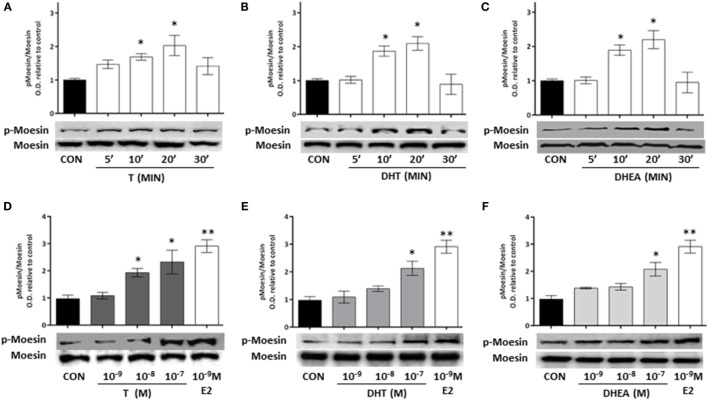
Figure 3.
Androgen administration to T47D cells results in Moesin activation. (A–C) T47D cells were treated for different times (5, 10, 20, and 30 min) with 10−8M T, DHT, and DHEA. (D–F) T47D cells were treated for 20 min with increasing concentrations of T, DHT, and DHEA (10−9M–10−7M), E2 was used as control. Whole cell extracts were resolved by SDS-PAGE, and wild-type Moesin and Thr558-phosphorylated Moesin (p-Moesin) levels were analyzed by western blot. Images are representative of triplicate experiments. Representative images are shown, and the bar graph show the mean ± SEM of the ratio Moesin/p-Moesin optical density relative to control of three independent experiments (*p ≤ 0.05, **p ≤ 0.01, ***p ≤ 0.001 versus control).

