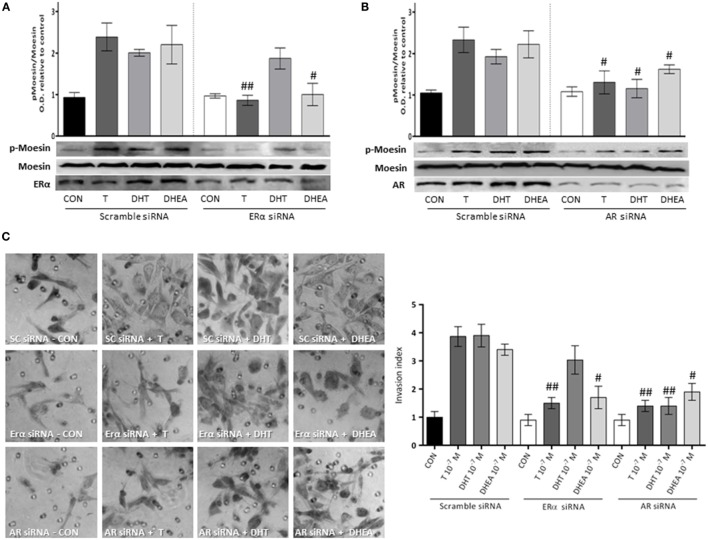
Figure 6.
Androgens activation of Moesin and T47D cell invasion: relative contribution of ER and AR. T47D cells were transfected with ERα, AR, and Scramble siRNAs 24 h before experiments were performed. (A,B) Transfected Cells were treated for 20 min with 10−7M T, DHT, or DHEA, and protein extracts were obtained. Western blot for total Moesin, p-Moesin, ERα, and AR were done. Images are representative of triplicate experiments. Representative images are shown, and the bar graph shows the mean ± SEM of the ratio Moesin/p-Moesin optical density relative to control of three independent experiments (#p ≤ 0.05, ##p ≤ 0.01 versus each treatment with Scramble siRNA). (C) Transfected cells were treated with 10−7M T, DHT, or DHEA, and cell invasion was assayed with matrigel invasion chambers for 24 h. Invasion index was quantified from the mean number of invading cells in the membrane. Images are representative, and the bar graph shows the mean ± SEM of invasion index relative to control of three independent experiments (#p ≤ 0.05, ##p ≤ 0.01 versus each treatment with Scramble siRNA).

