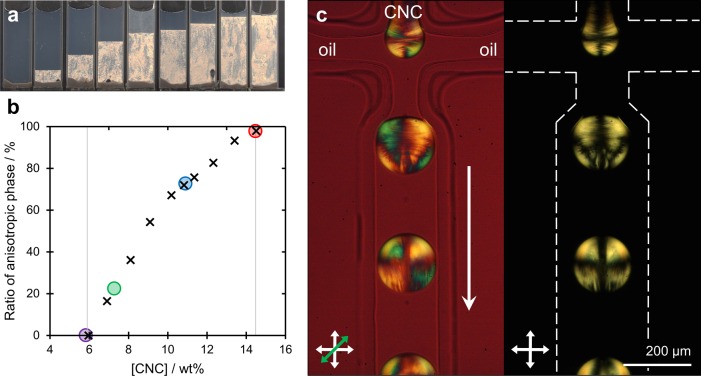
Figure 1.
(a) Phase behavior of CNC suspensions of increasing concentration, as imaged under cross-polarizers, where a clear transition from pure isotropic to anisotropic phase is observed from left to right. (b) Calculated ratio of anisotropic phase present for each concentration investigated in (a) was used to compile the phase diagram (crosses). The specific concentrations investigated within microdroplets are indicated by the colored circles. (c) Polarization micrograph of the generation of microfluidic water-in-oil droplets from a 14.5 wt % suspension of CNCs, as imaged under cross-polarizers (right) and with a first-order tint plate (left), illustrating the initial radial assembly.

