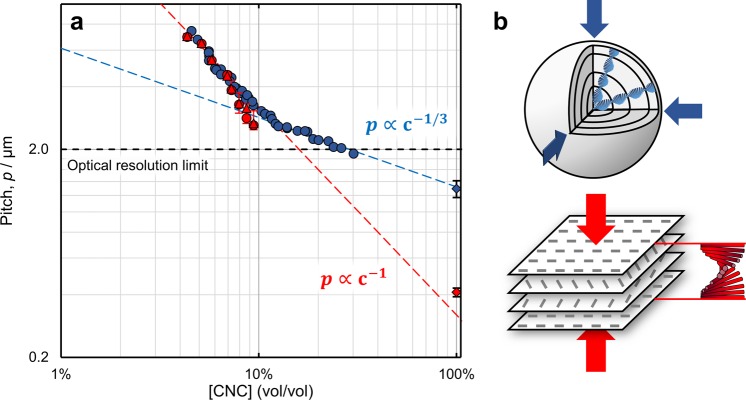
Figure 3.
(a) Evolution pitch diagram. The cholesteric pitch measured in the droplets (blue circles) is compared against a macroscale capillary measured by laser diffraction (red circles) and microscopy (red triangles). The pitch below 2 μm was not measured due to the optical resolution limit. Upon increasing CNC concentration, the measured cholesteric pitch in the droplets is initially consistent with the pitch measured in the capillary; however, for the case of confined suspensions, a transition at cg = 12% v/v (∼19 wt %) is observed. Extrapolation of the c–1 and c–1/3 trend lines correlates with the pitch measured by scanning electron microscopy for a dry film and microparticle, respectively (diamonds). The capillary error bars correspond to the gradient in pitch observed as a function of position within the anisotropic phase, as shown in Figure S16, Supporting Information. (b) Schematics illustrating the effect on the helicoidal cholesteric structure upon three-dimensional contraction when confined within a sphere, as occurs after cg (p ∝ c–1/3, top), compared to unidirectional contraction in a planar geometry (p ∝ c–1, bottom).

