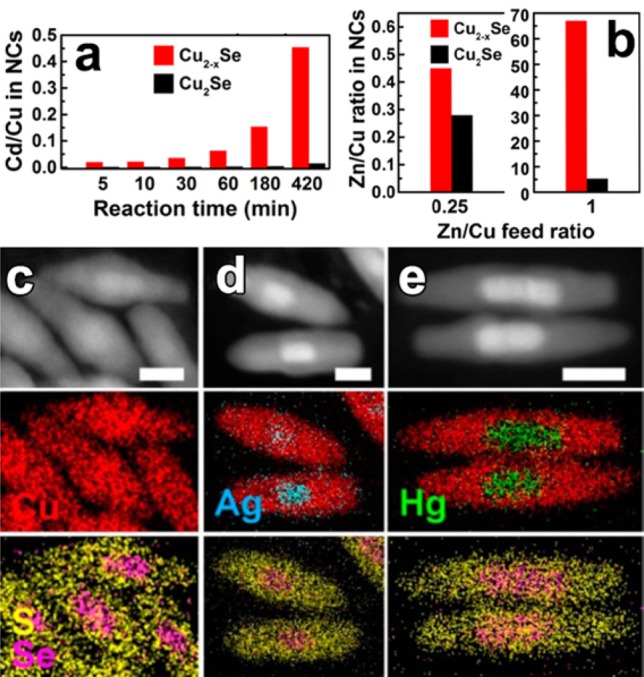
Figure 4.

(a) Diagrams displaying the evolution of the Cd/Cu ratio in the heavily substoichiometric (Cu2–xSe, red) and close to stoichiometric (Cu2Se, black) NCs over the time of the Cu+ → Cd2+ CE reaction at RT using a Cd/Cu feed ratio of 0.5. (b) Diagrams displaying the dependence of the Zn/Cu ratio in the vacant (red) and stoichiometric (black) NCs on the Zn/Cu feed ratio in overnight CE reactions at RT. Reproduced from [Lesnyak, V.; Brescia, R.; Messina, G. C.; Manna, L. Cu Vacancies Boost Cation Exchange Reactions in Copper Selenide Nanocrystals J. Am. Chem. Soc.2015, 137, 9315–9323]. Copyright 2015 American Chemical Society. (c–e) CE in Cu2–xSe/Cu2–xS NRs with Ag+ and Hg2+ ions. HAADF-STEM images of groups of (c) pristine, (d) Ag+, and (e) Hg2+ partially exchanged Cu2–xSe/Cu2–xS NRs with the corresponding STEM-EDS elemental maps. Scale bars are 20 nm. Reproduced from [Miszta, K.; Gariano, G.; Brescia, R.; Marras, S.; De Donato, F.; Ghosh, S.; De Trizio, L.; Manna, L. Selective Cation Exchange in the Core Region of Cu2-xSe/Cu2-xS Core/Shell Nanocrystals J. Am. Chem. Soc. 2015, 137, 12195–12198]. Copyright 2015 American Chemical Society.
