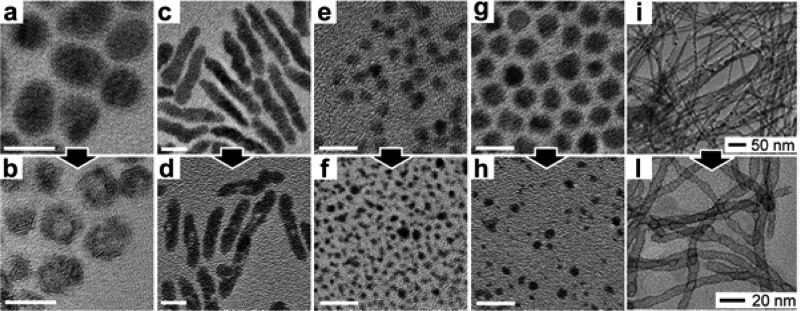
Figure 9.
TEM images of the reactant CdE (E = S, Se, and Te) and fully exchanged product NCs. In the Figure, each reactant-product pair is indicated by an arrow connecting the two panels: (a → b) CdTe-PtTe, (c → d) CdSe-PdSe, (e → f) CdS-PtS, (g → h) CdSe-PtSe, (i → l) CdTe-PtTe2. Scale bars in a–h are 10 nm. (a–h) Reproduced from [Wark, S. E.; Hsia, C.-H.; Son, D. H. Effects of Ion Solvation and Volume Change of Reaction on the Equilibrium and Morphology in Cation-Exchange Reaction of Nanocrystals J. Am. Chem. Soc. 2008, 130, 9550–9555]. Copyright 2008 American Chemical Society. (i–l) Reproduced from [Moon, G. D.; Ko, S.; Xia, Y.; Jeong, U. Chemical Transformations in Ultrathin Chalcogenide Nanowires ACS Nano2010, 4, 2307–2319]. Copyright 2010 American Chemical Society.

